About Me
I am Nils-Erik Bjorn Rundquist, I am a senior data solutions engineer at EDF Renewables North America in San Diego, California.
I work primarily in developing cost estimation and data tracking tools for grid-scale solar and battery energy storage system power projects.
Before entering the solar renewables world, I worked as a software engineer in the Optical InfraRed Laboratory at UCSD in the Center for Astrophysics and Space Sciences. That work was primarily concerned with performance modeling of large telescope instruments to aid in design and construction of future astronomical instruments, particularly for instruments designed for adaptive optics systems. I also simulated astronomy science cases and have deployed simulation tools for astronomers around the world to use for testing the scientific viability of their research.
I began working within the grid-scale solar power renewable energy space in March of 2023. Prior to this, I worked in software development for astronomical instruments in data reduction and performance modeling for six years. I have extensive experience in software engineering and deployment, and have utilized my expertise in data analysis to aid in the design and construction of the data reduction pipelines of multiple world-class astronomical instruments. I have presented and been published multiple times in the photonics SPIE conference. I got my Bachelor's in Science at the University of California San Diego in Physics with a Specialization in Astrophysics.
Prior to my work in astrophysics I worked as an outdoor instructor with Outback Adventures for 6 years. There I gained communications and leadership skills which aids in my scientific career and enables my scientific communications ability. My outdoor guiding expertise extended to rock climbing, backpacking, and sea kayaking.
The public portion of the code repositories I manage or am involved in are visible at my github (as is the code I wrote to make this site.) I maintain various software packages including the simulation software for the InfraRed Imaging Spectrograph, the OH-Suppressing Infra-Red Imaging Spectrograph (OSIRIS), and Liger instruments.
I am the primary author of the OSIRIS ETC.
Following are some figures and descriptions of some of the projects I have completed over the course of my work in astronomy instrumentation simulation.
Liger is a new instrument for the W.M. Keck Observatory on Mauna Kea in Hawaii which will fully utilize the new updated Keck All-Sky Precision Adaptive optics (KAPA) system. I estimated sensitivity in source brightness at which SNR=10 is achieved in an integration time of 104 seconds for various near-infrared competing instruments from world-wide observatories as compared to Liger. The solid lines indicate Liger’s performance, dashed lines indicate existing instruments, and dotted lines indicate upcoming future instruments. Instrumental filter modes, shown in the shaded regions for each plot, illustrate that Liger provides the widest wavelength range of any competing instrument, and offers the highest performance in sensitivity, with exception of JWST in the coarse scale.
The Galactic Center is one of the most interesting and important science regimes for large adaptive-optics-enabled ground-based telescopes. Incorporating simulated Point Spread Functions (PSFs), I simulated the performance of Liger in Integral Field Spectrograph (IFS) mode in comparison withs imulations of the existing OH-Suppressing Infra-Red Imaging Spectrograph (OSIRIS) instrument.
The InfraRed Imaging Spectrograph (IRIS) is an imaging camera and integral field spectrograph that will be used to sample the Narrow-Field Infrared Adaptive Optics System. To better understand IRIS science specifications I simulated the relative photometric precision and accuracy across the IRIS imaging camera 34”x34”field of view. Because the the Point Spread Function (PSF) varies due to the effects of anisoplanatism, I used the Anisoplanatic and Instrumental Reconstruction of Off-axis PSFs for AO (AIROPA) software package to conduct photometric measurements on simulated frames using PSF-fitting as the PSF varies in single-source, binary, and crowded field use cases. My characterization of the confusion and anisoplanatic effect results are shown to the right. My full paper is viewable here.
I simulated the Galactic Center in K, planting known sources down to 23rd magnitude and random sources down to 27th magnitude randomly distributed. I simulated 130200 sources, which is an underestimate of the actual number expected to be observed following the advent of 30-meter-class telescopes. I found the processing of the simulated frames to be highly dependent on the PSF-fitting requirements to AIROPA. Using PSF-fitting correlation values of 0.8, 0.7, 0.6, and 0.5 I achieved a source recovery of 3.4%, 6.6%, 9.7%, and 12.6% respectively as shown in the figure left. In order to practically and accurately recover sources in such dense stellar fields, future improvements in PSF-fitting algorithms will be required. My full paper is viewable here.
Each frame in the movie is a simulated 2.2 second integration from the IRIS imager of Jupiter’s moon Io, estimated in the Z-band to maximize the effect of Rayleigh Scattering and minimize the contrast between the volcanic plumes and the surface brightness. I modeled the ejection of SO2 particles from a volcanic vent on Io; hitherto only detected by space telescopes. The location of the simulated eruption is Isum Patera, a known explosive hotspot on the surface of Io. The simulated temperature and power output are as observed by the Keck observatory during an eruption event on June 18, 2018. Using estimates of the internal and external pressure of Io and the likely magma composition, this simulation assumes a volcanic eruption with an initial particle velocity of 770 m/s, reaching a maximum height of 165 km. This is roughly half of the maximum known of large “Pele-Type” plumes of Io’s volcanoes, which have been observed to reach more than 1 km/s and heights of 500 km. Combining Rayleigh scattering effects with the blackbody spectrum of the expanding plume, I estimated the flux over time following a large explosive event.
Hobbies
I have a bad habit of collecting hobbies.
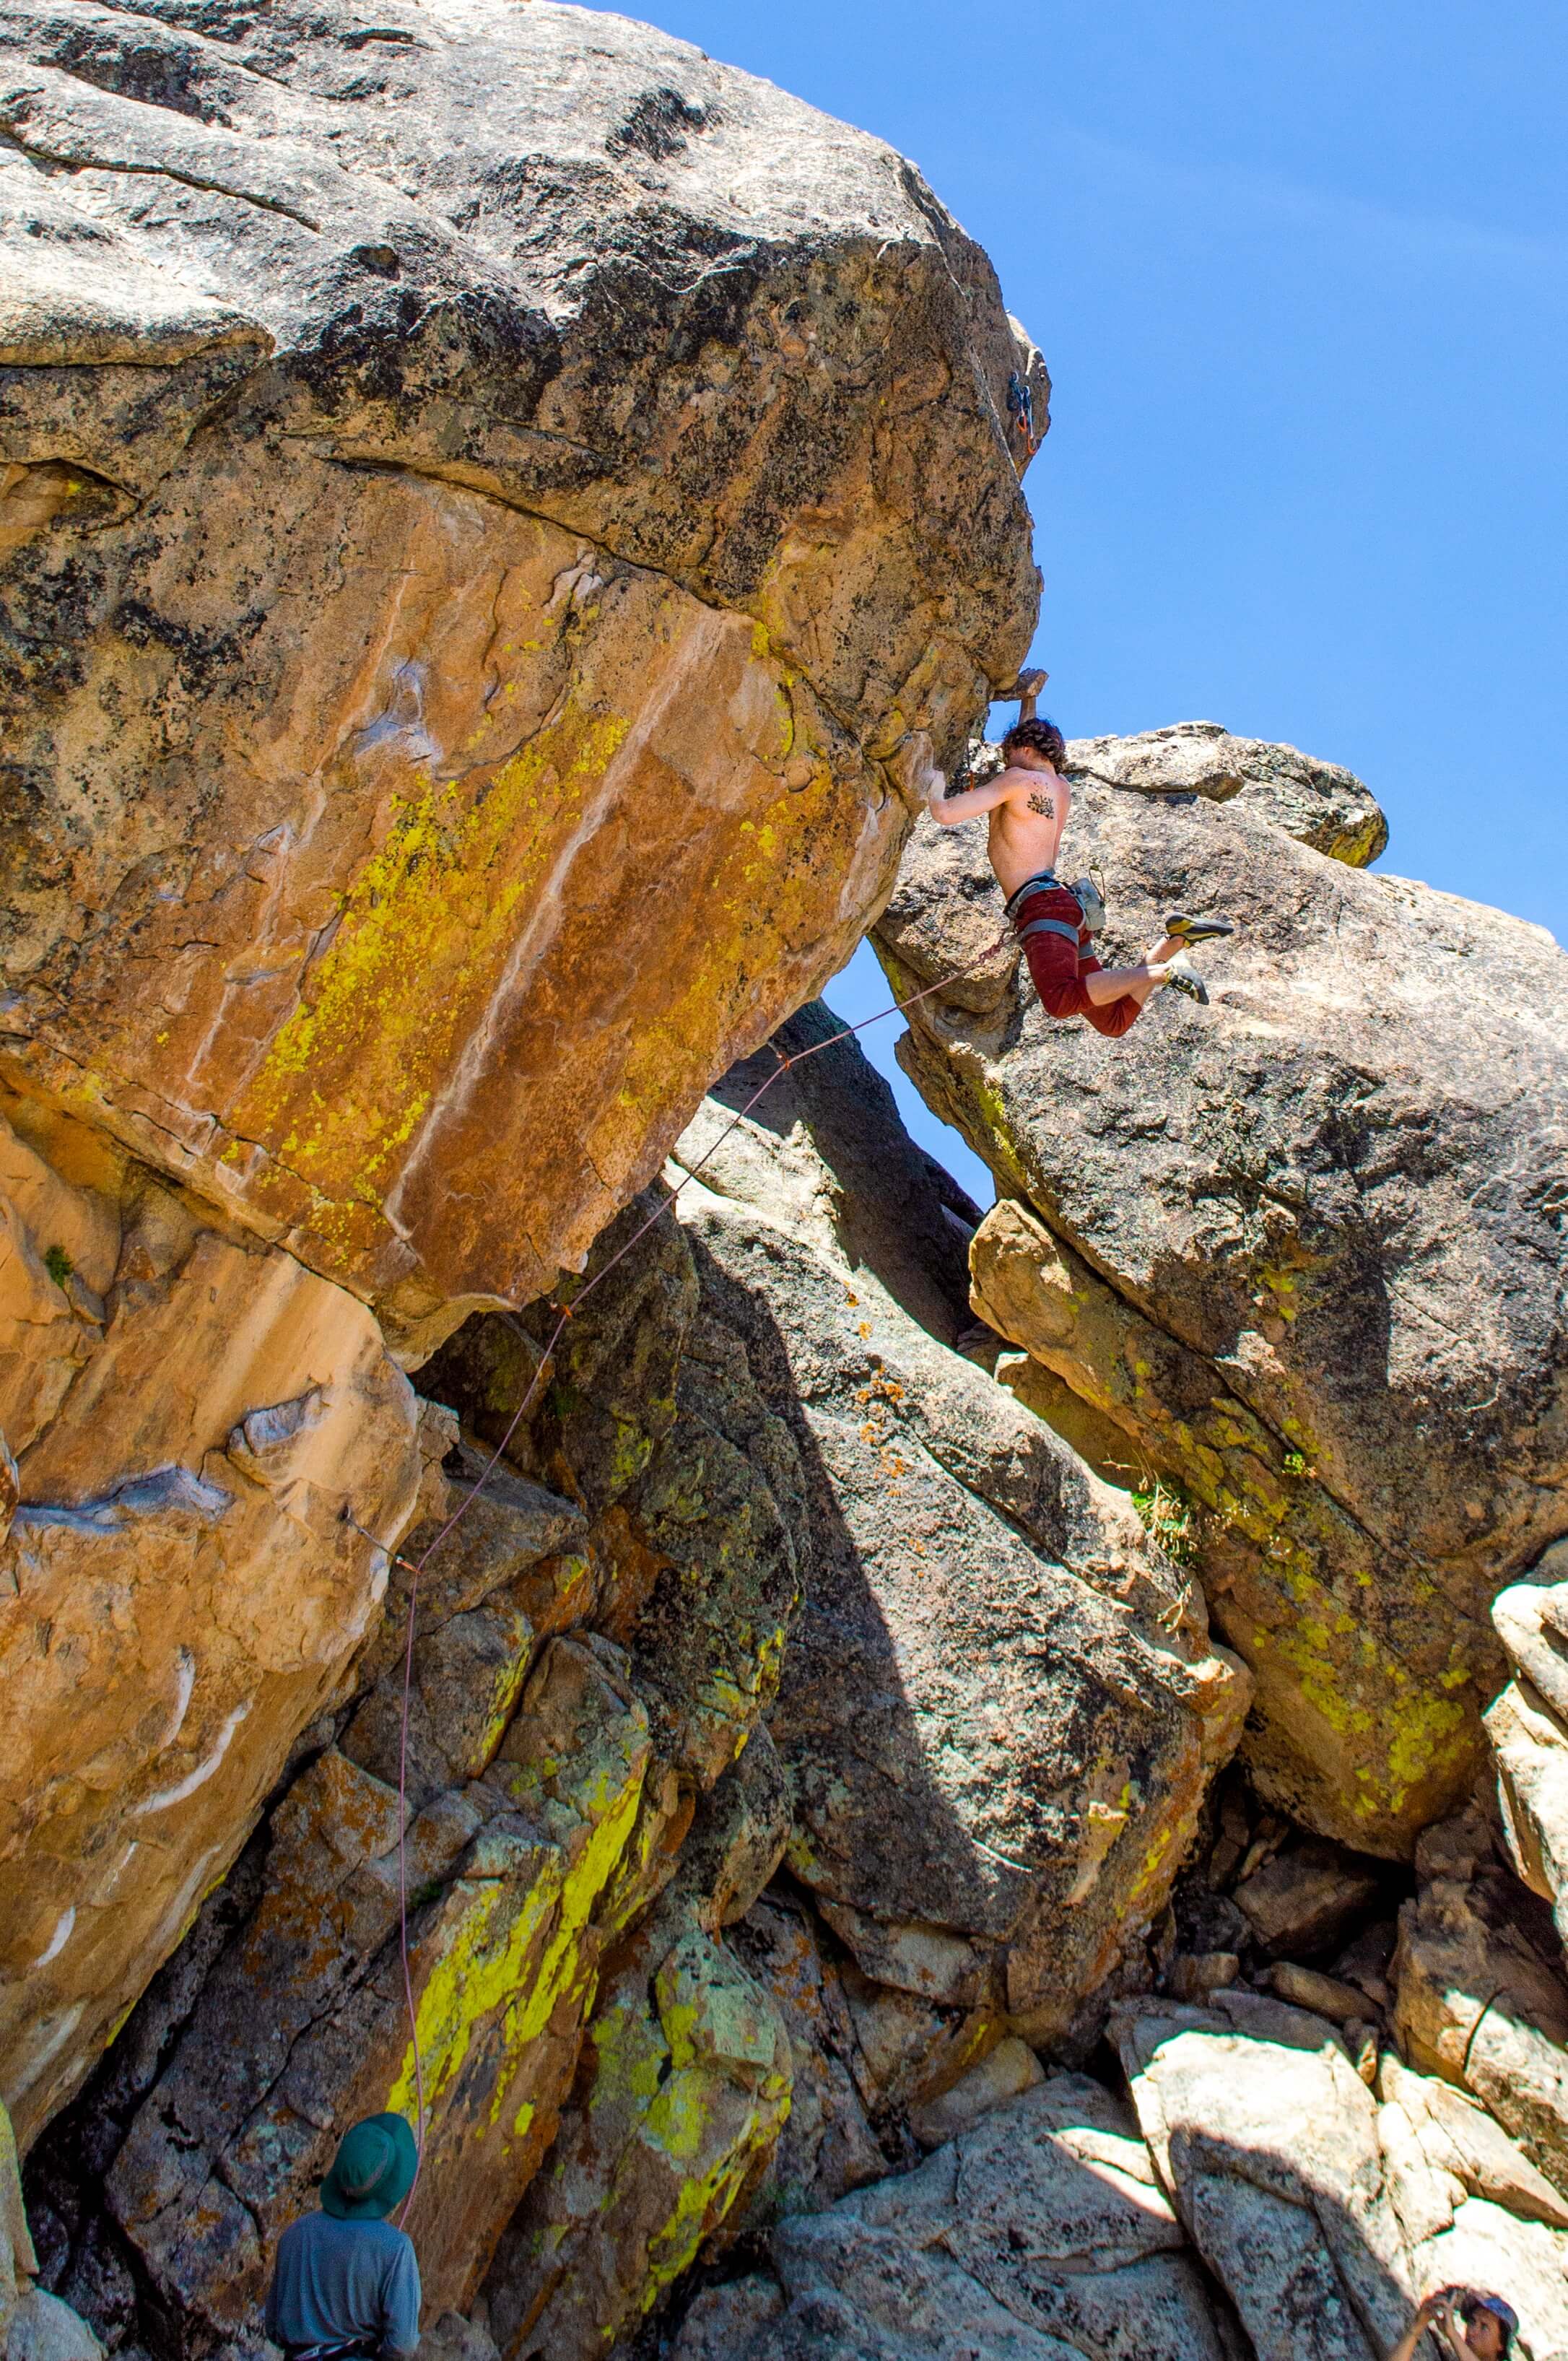
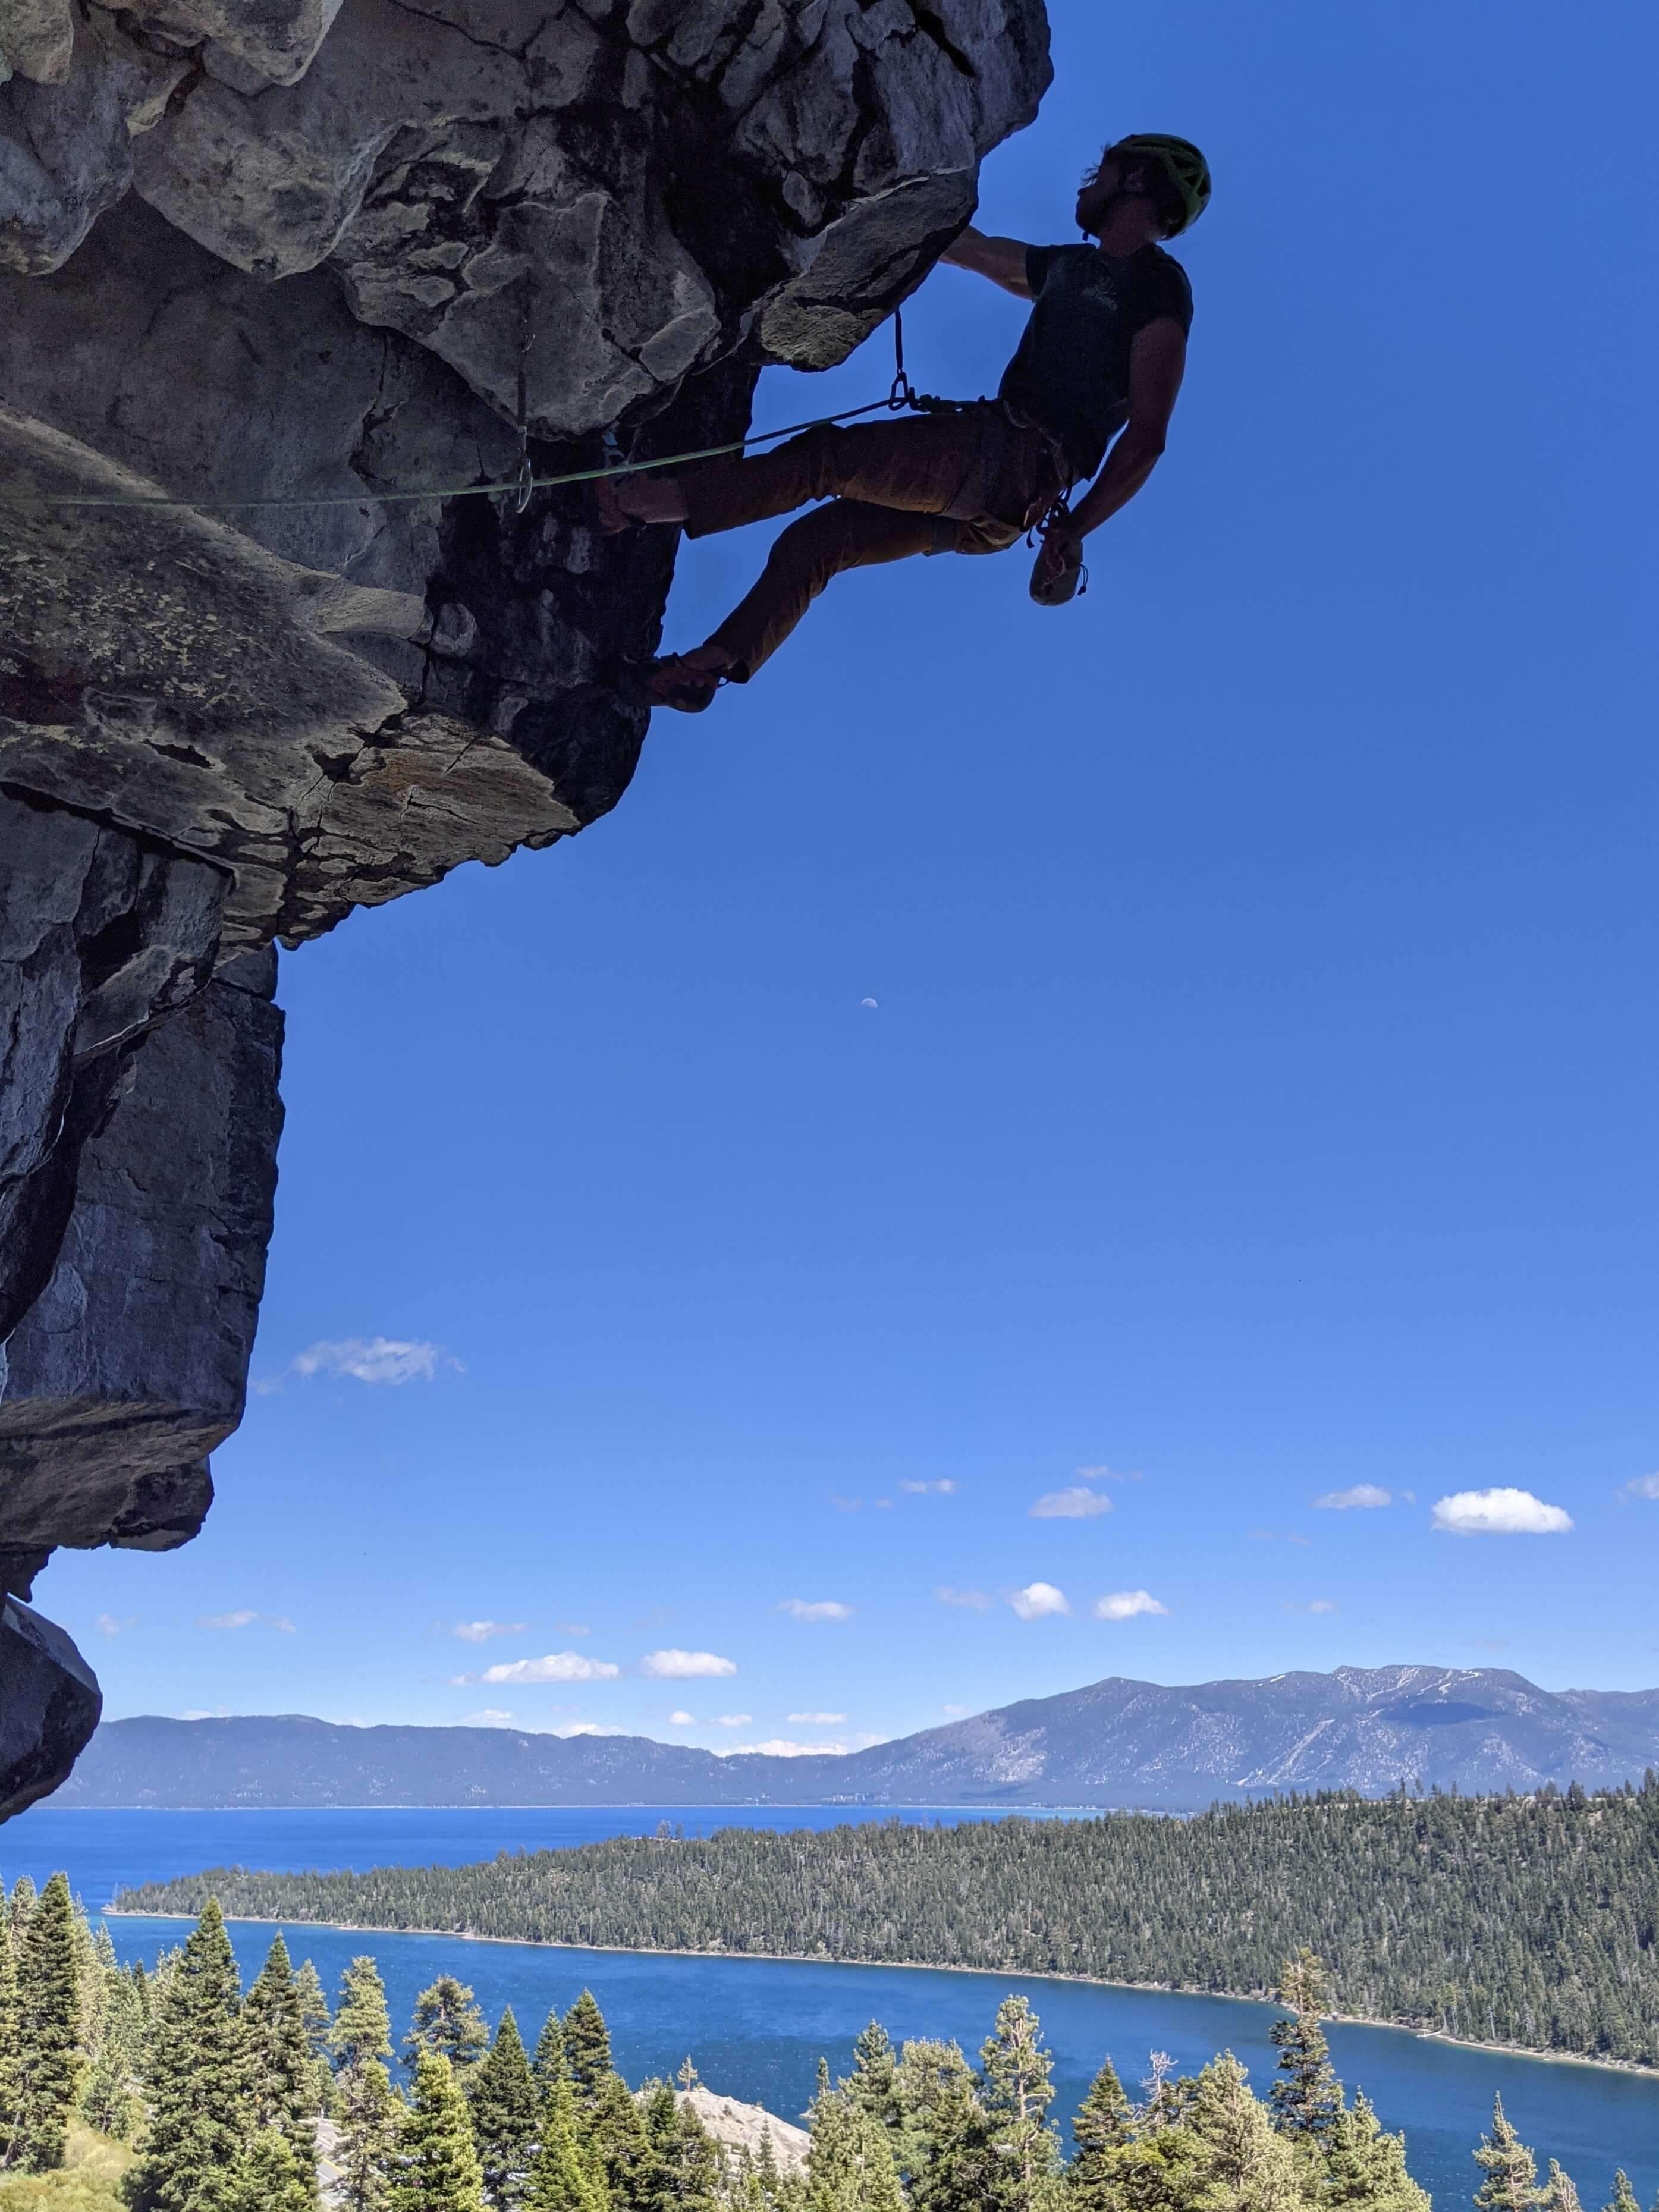
Climbing
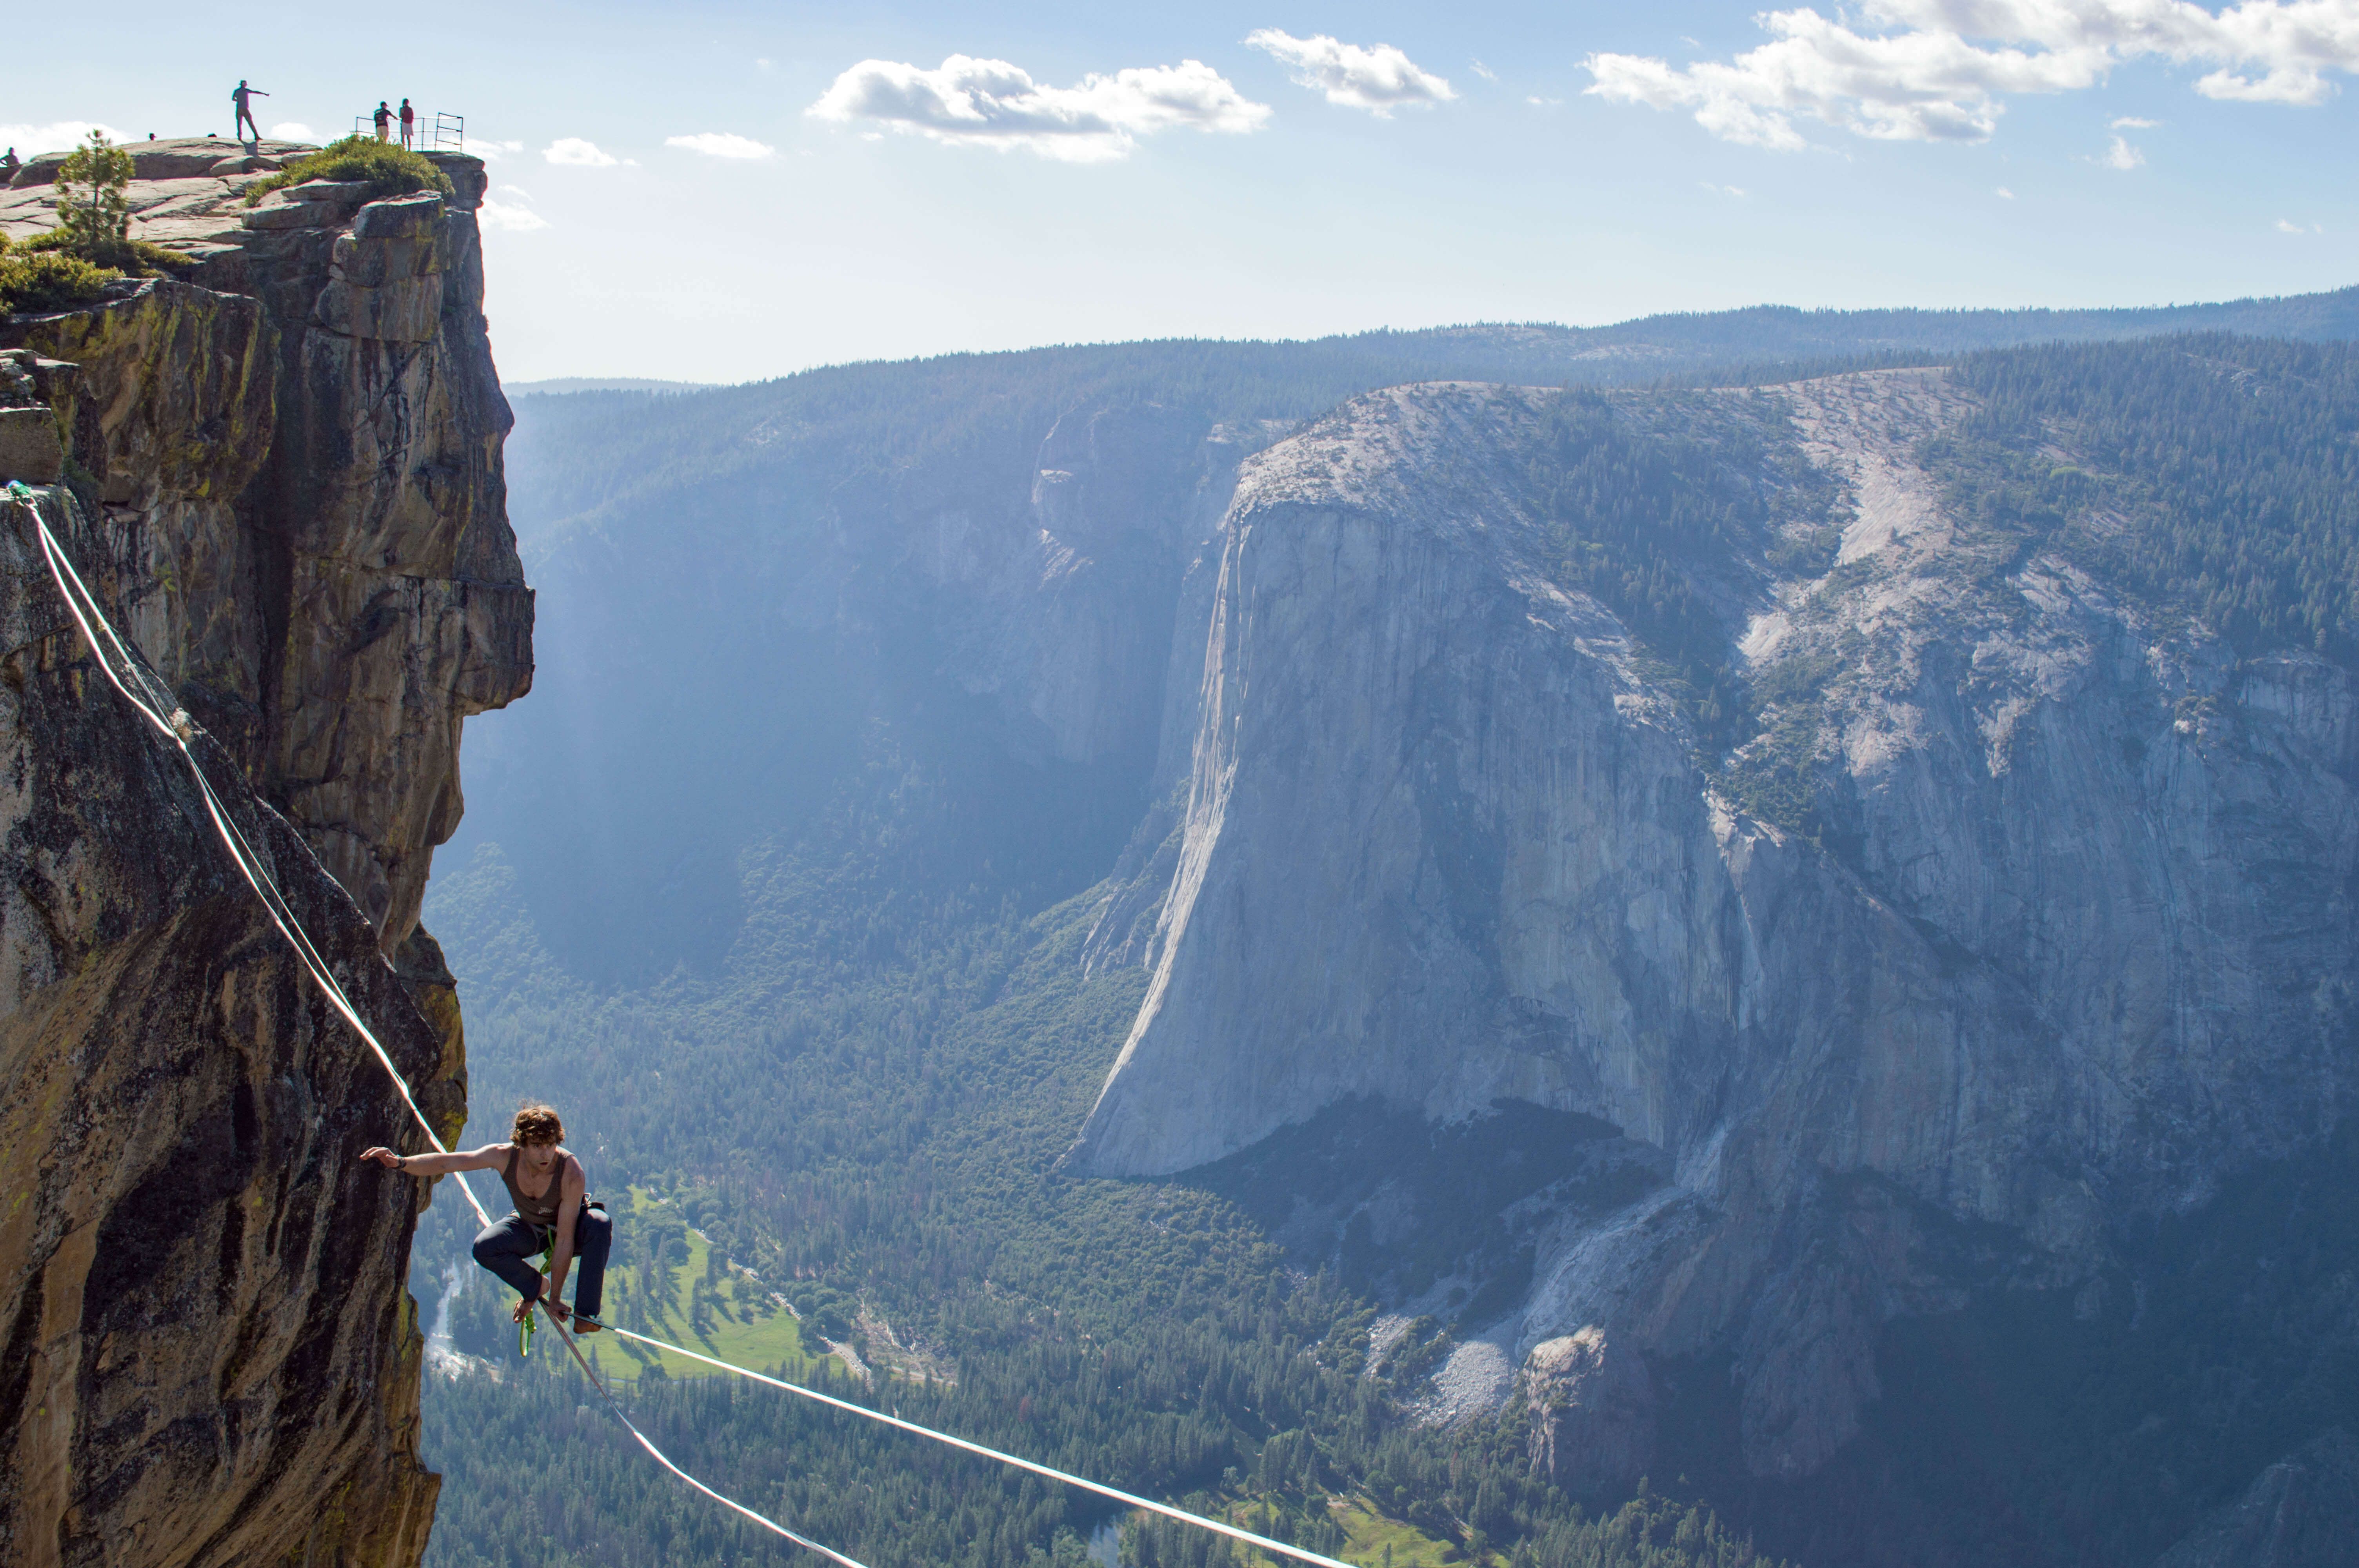
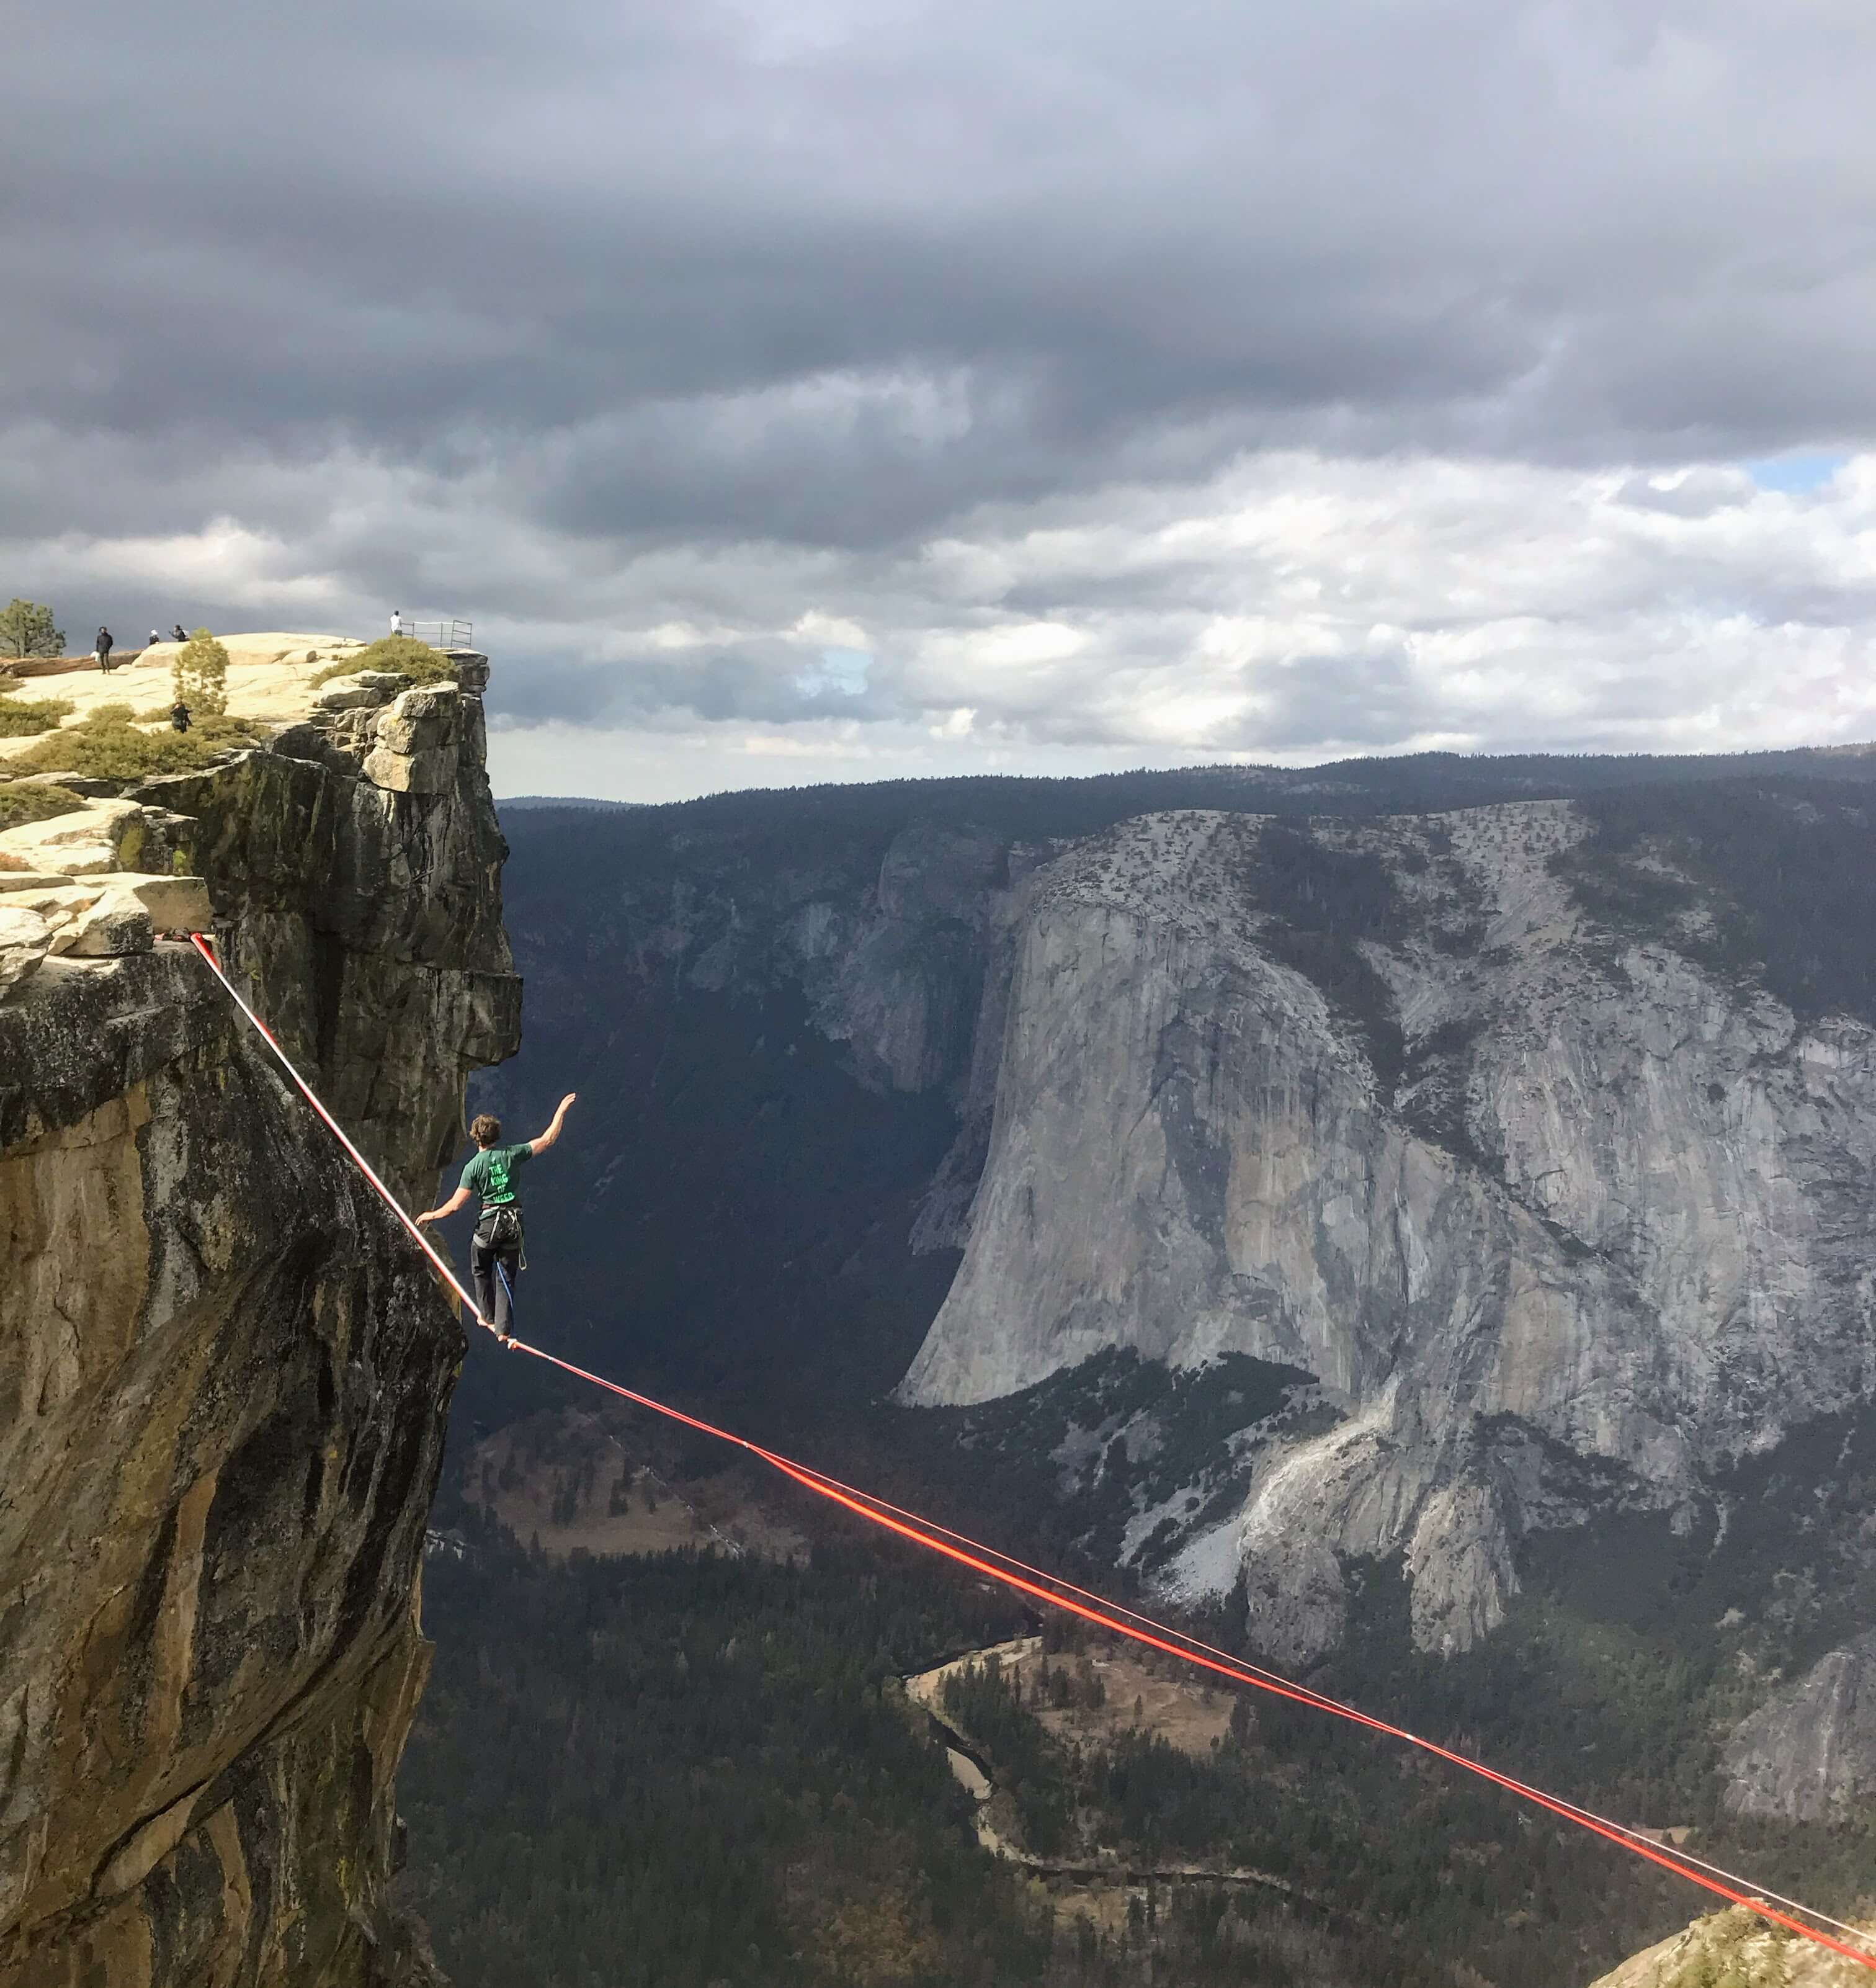
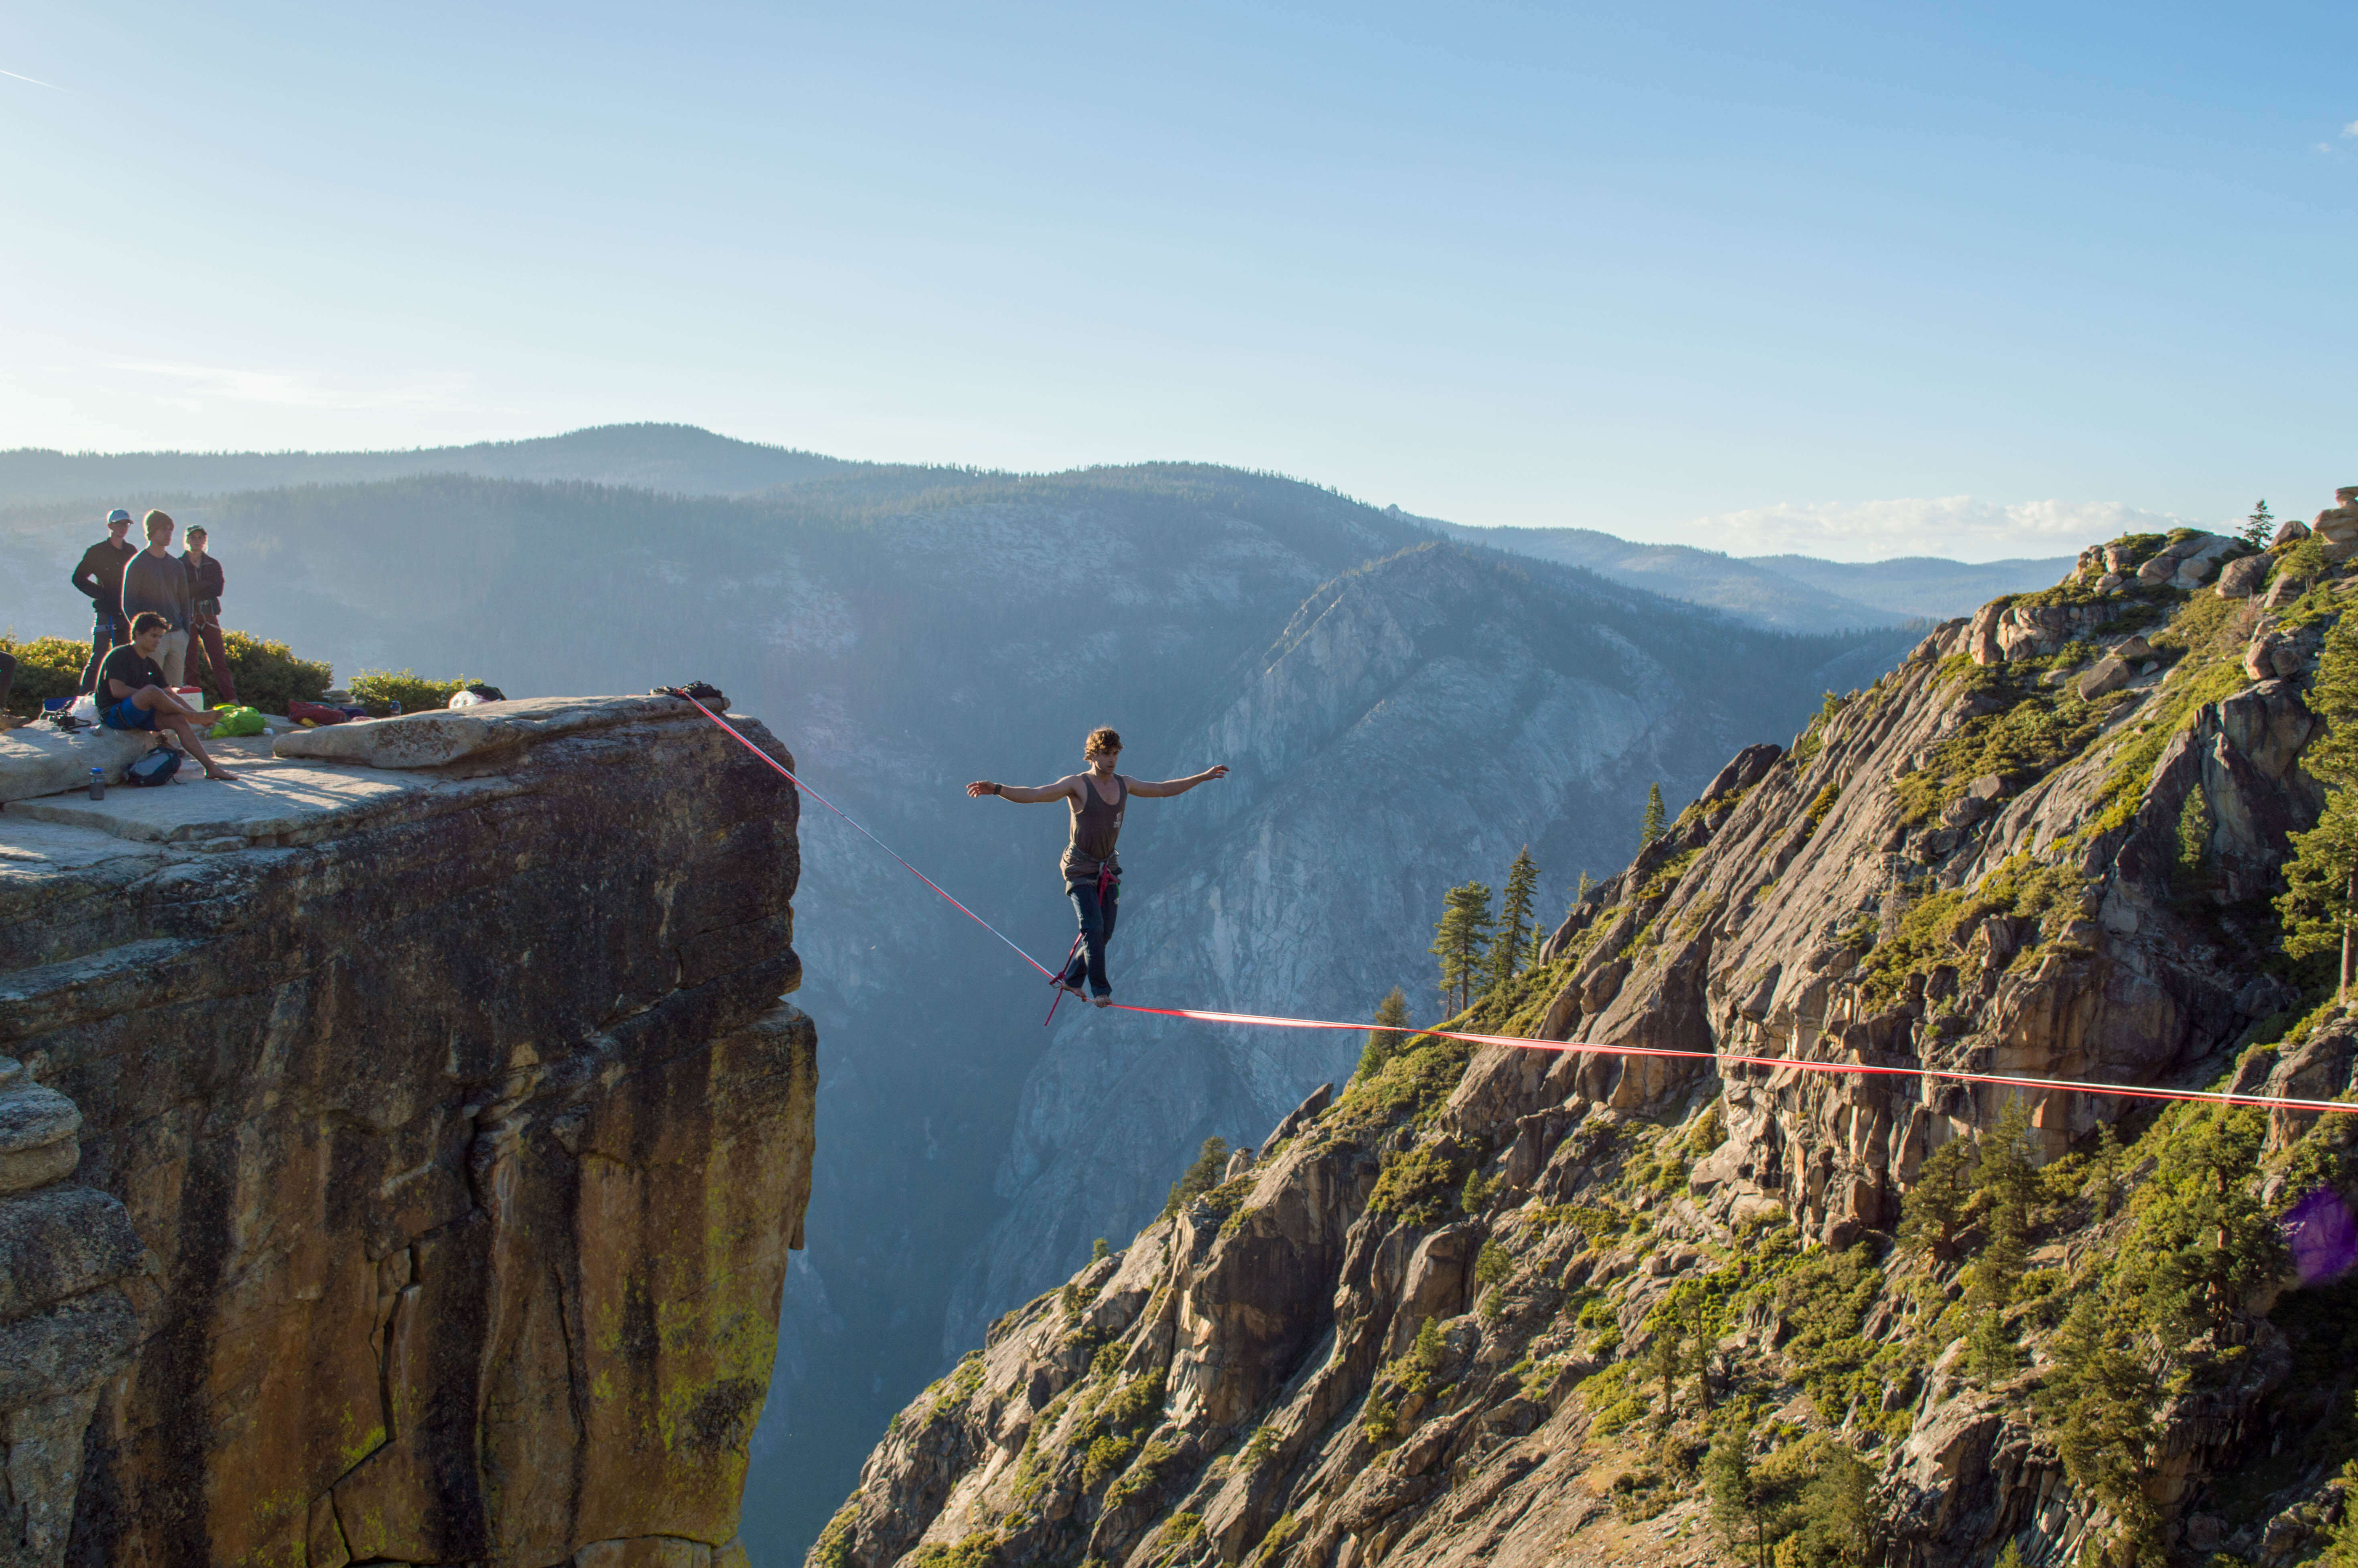
Highlining
.jpeg)
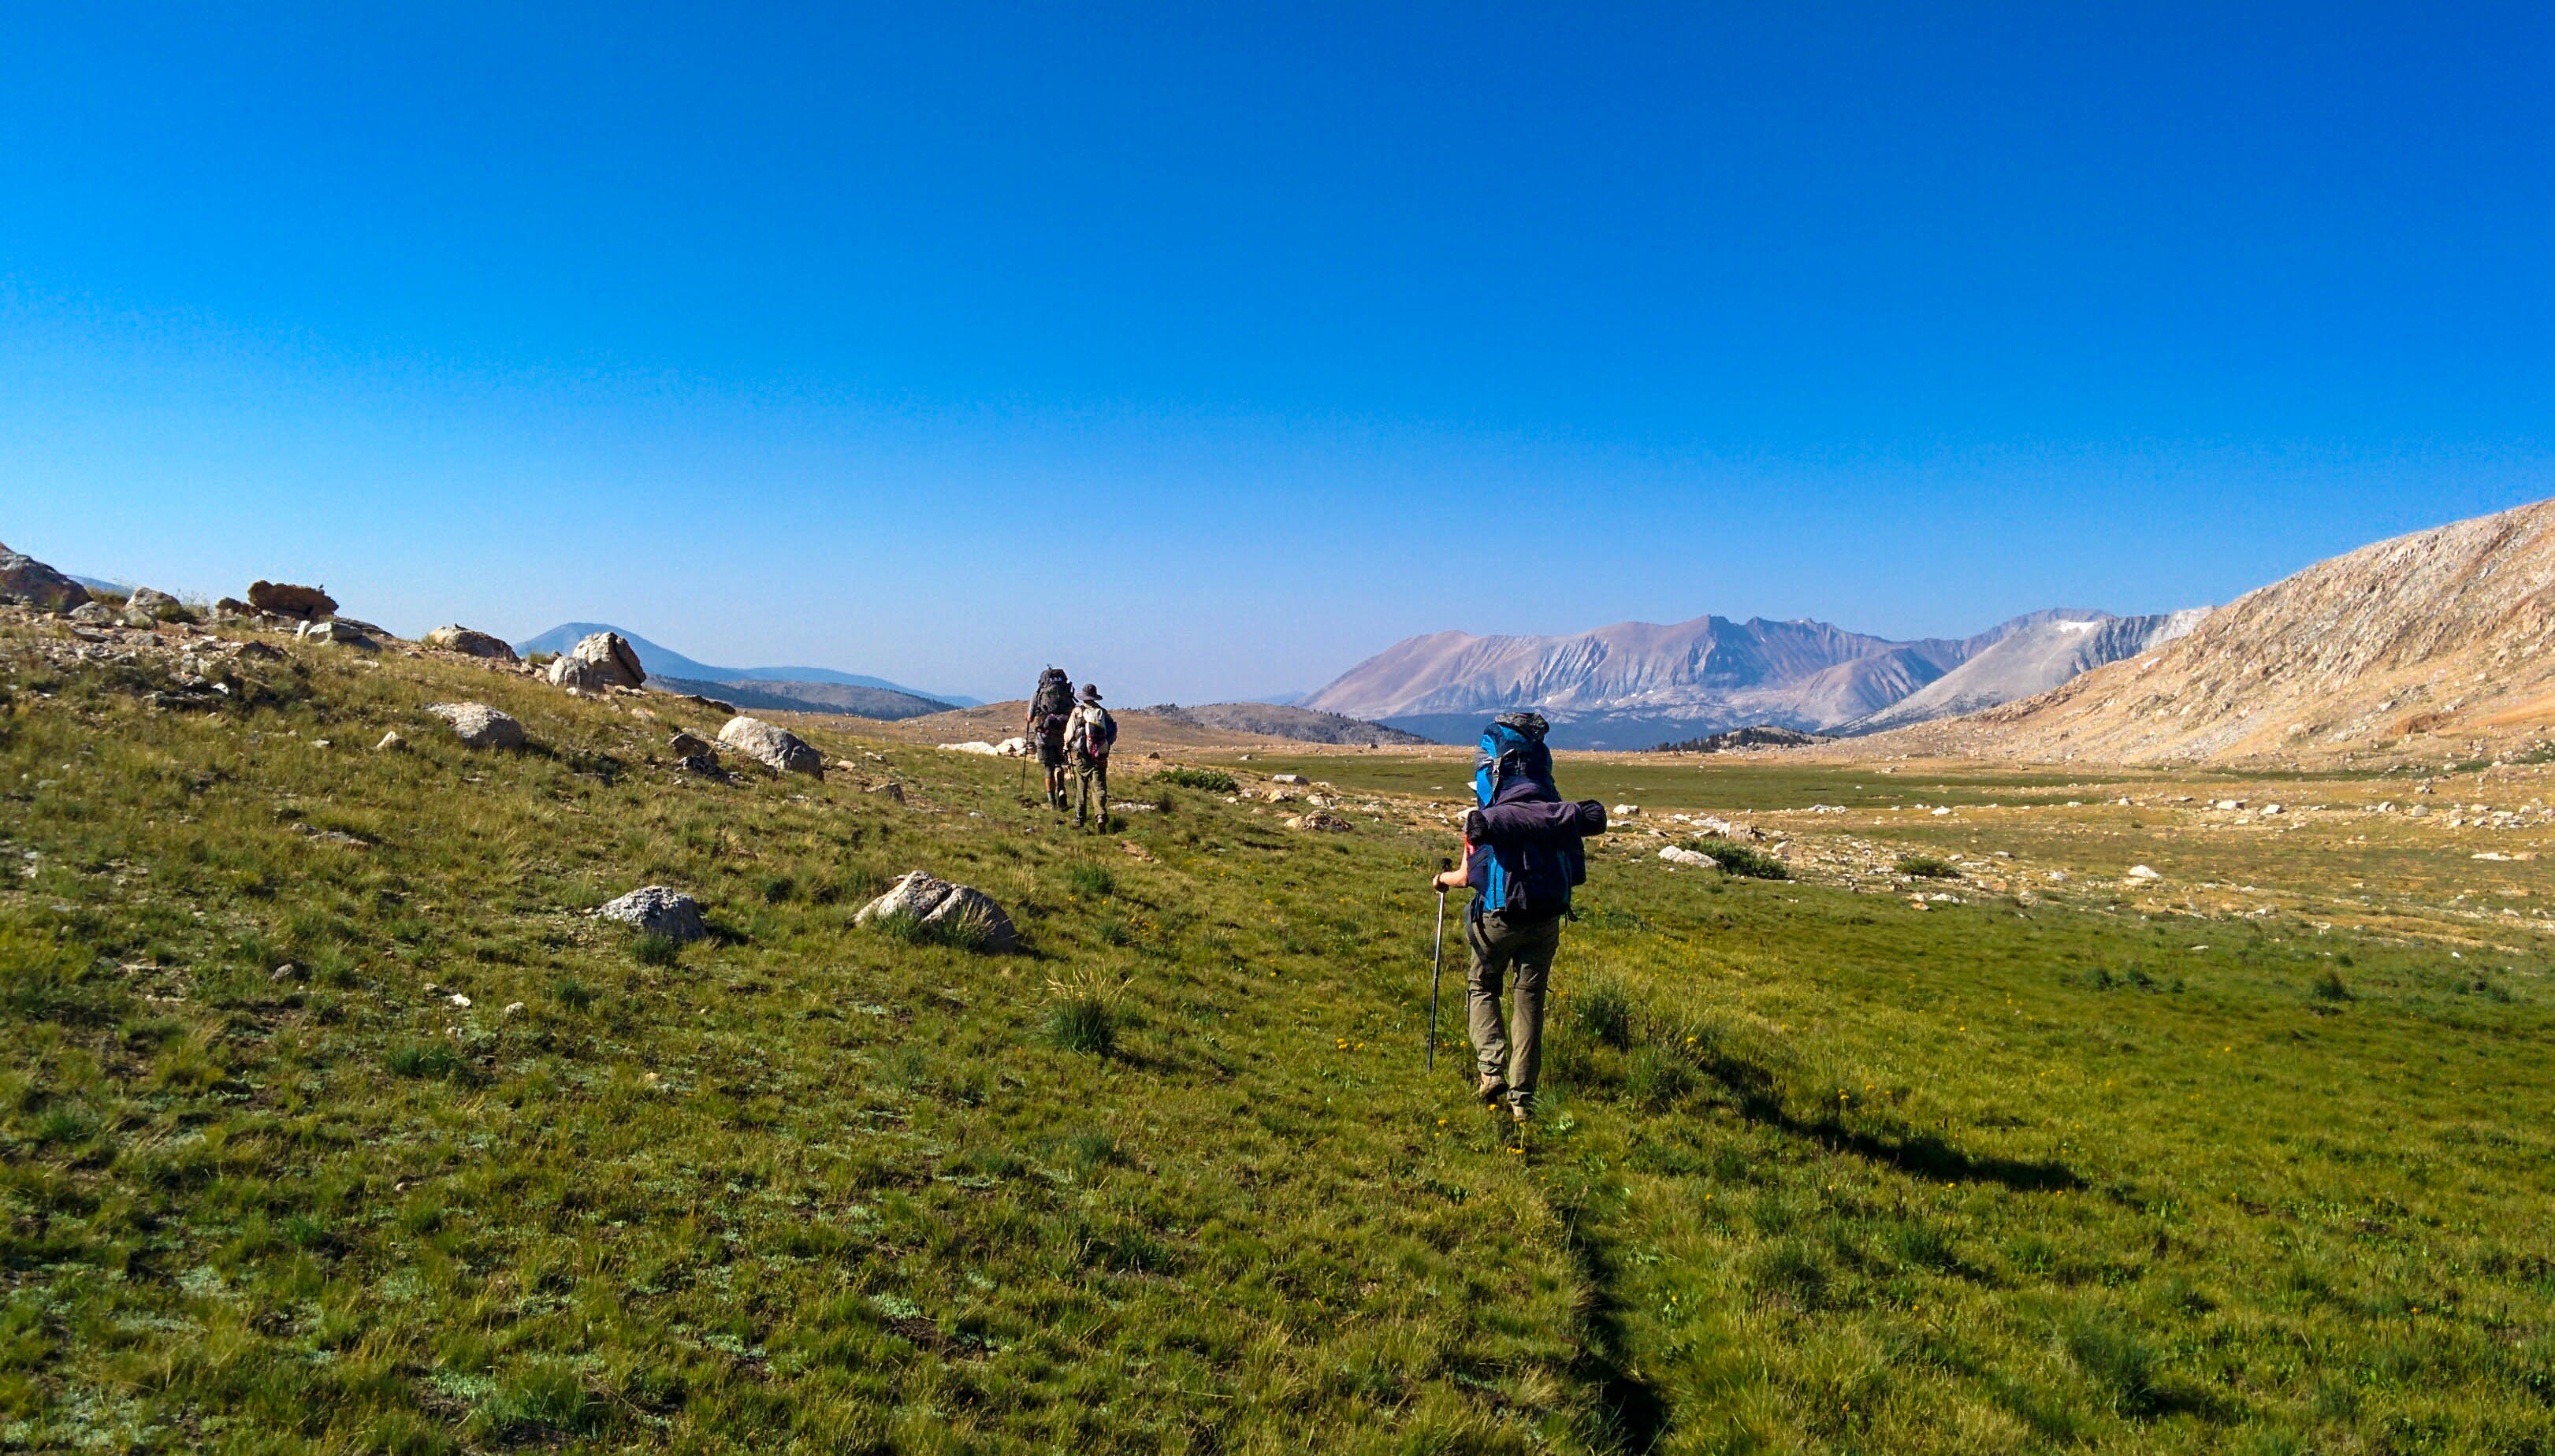
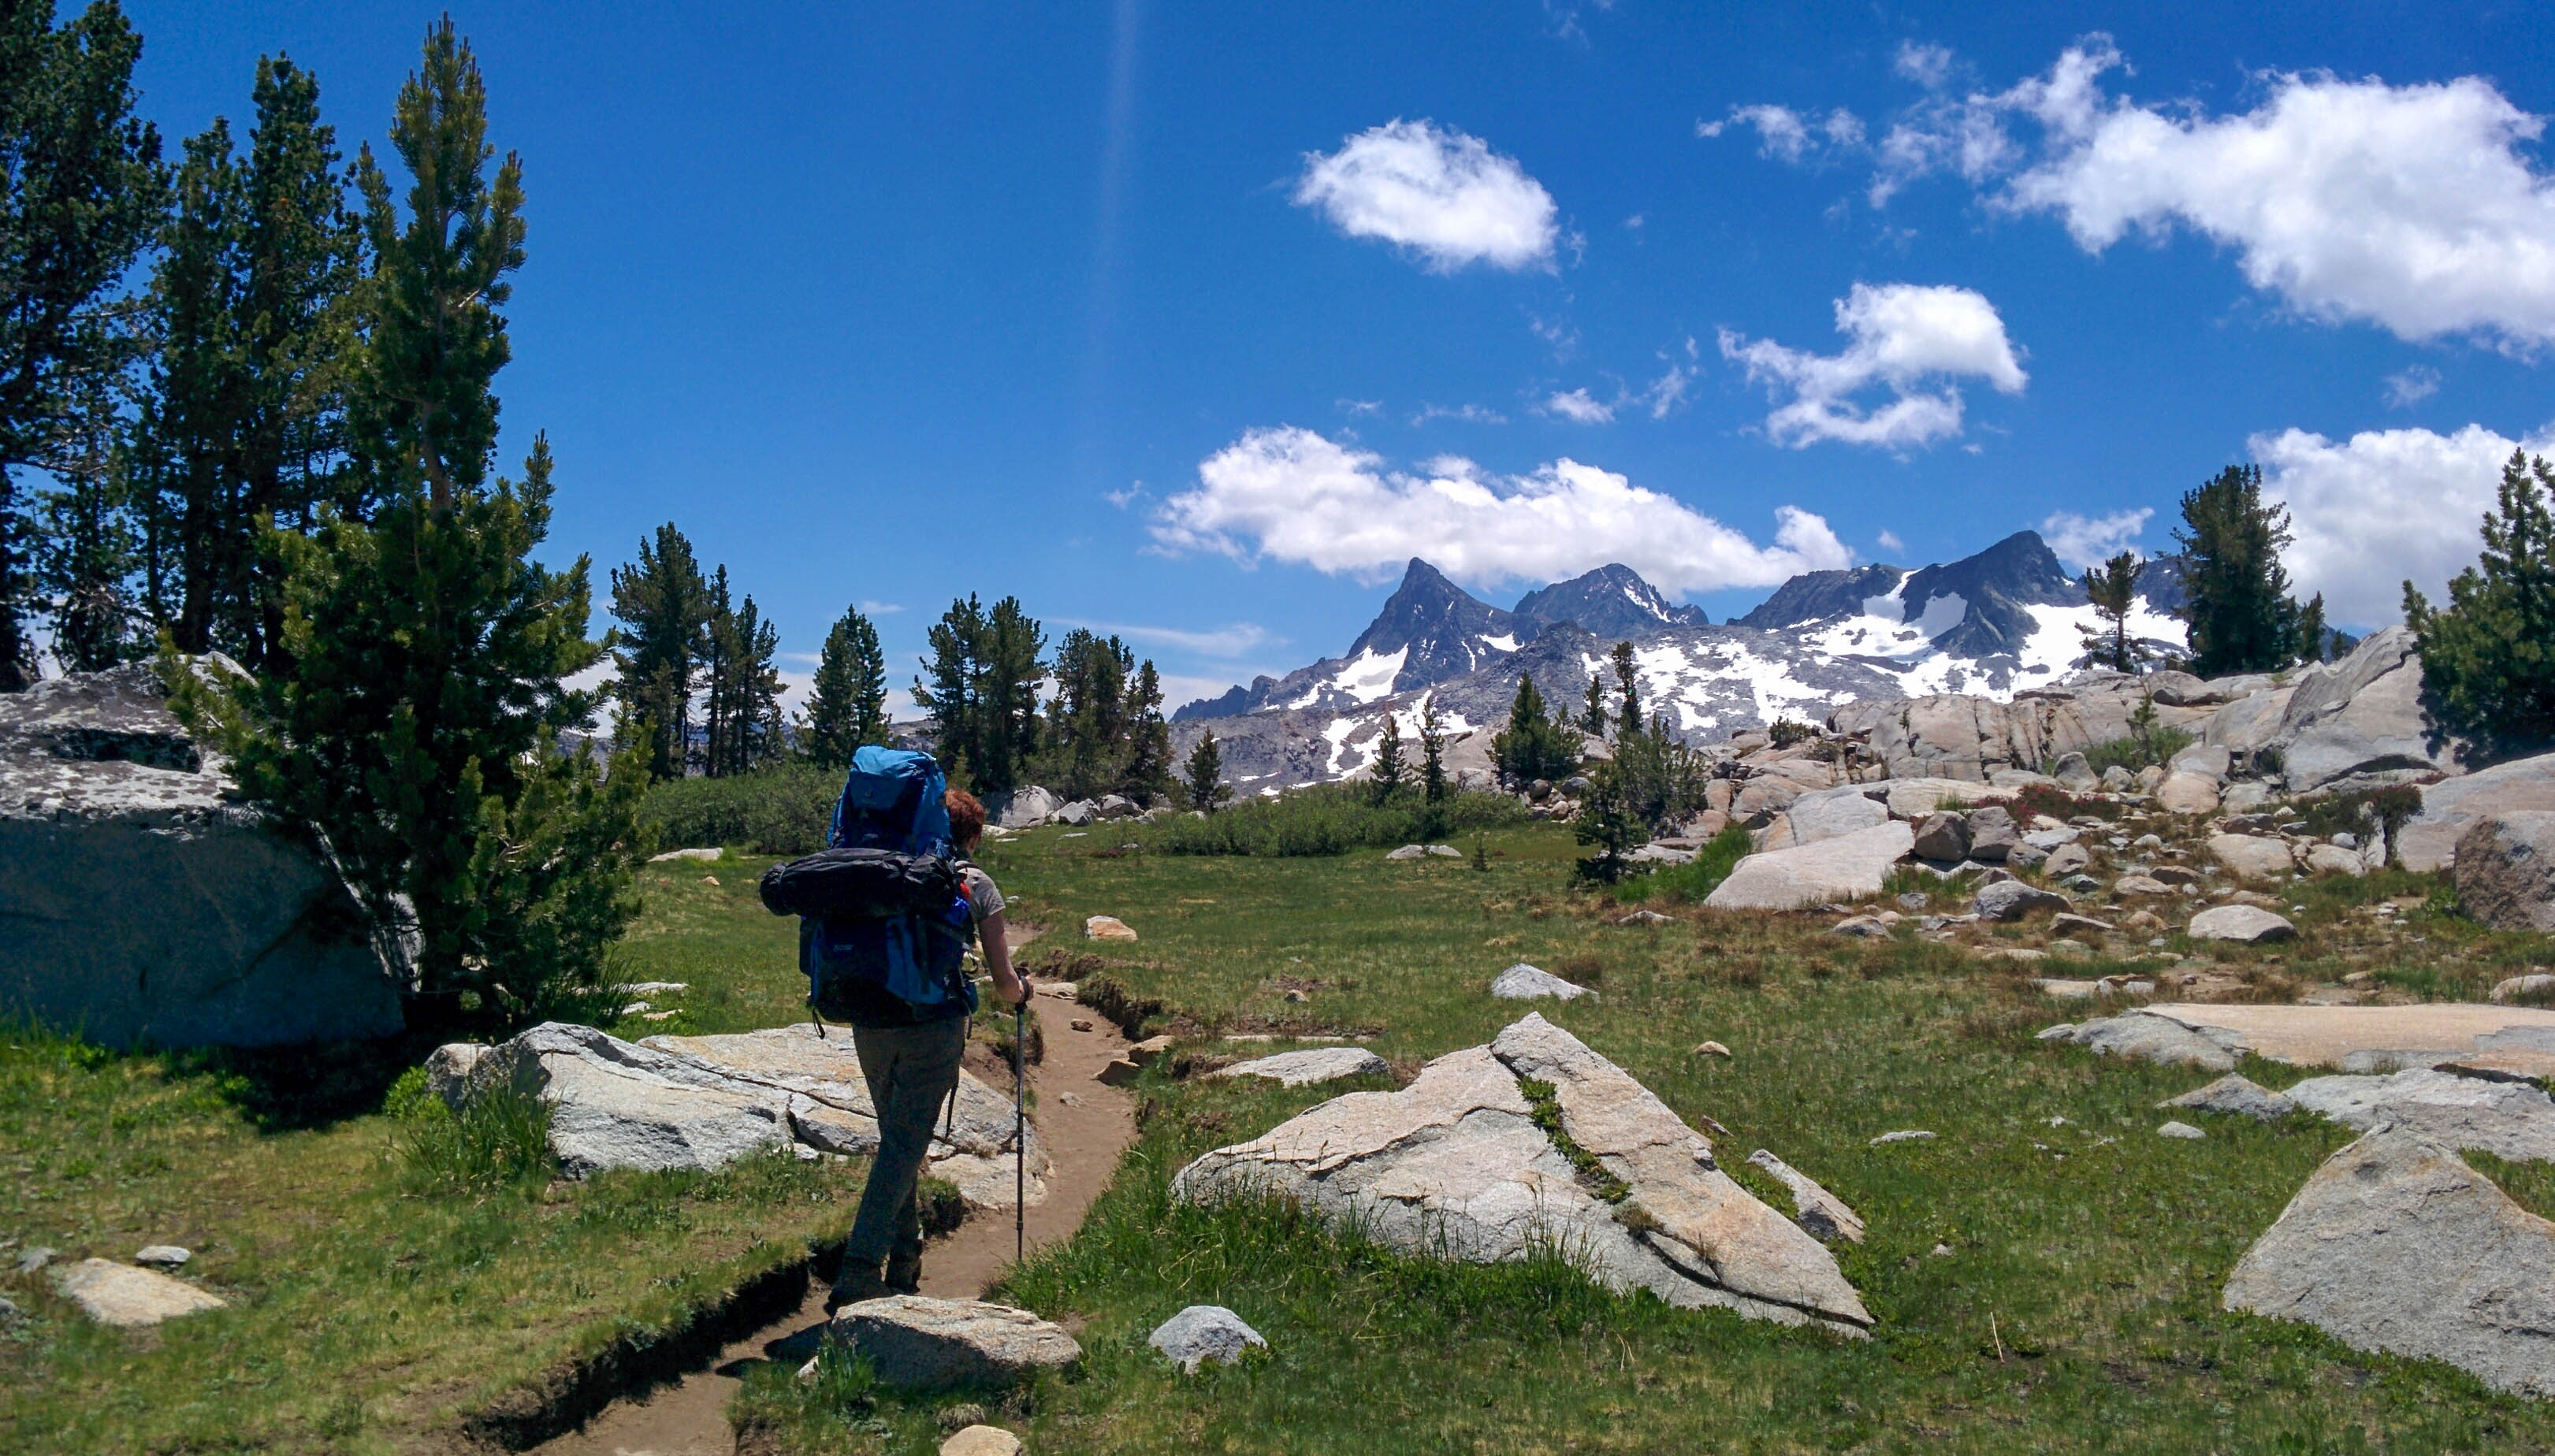
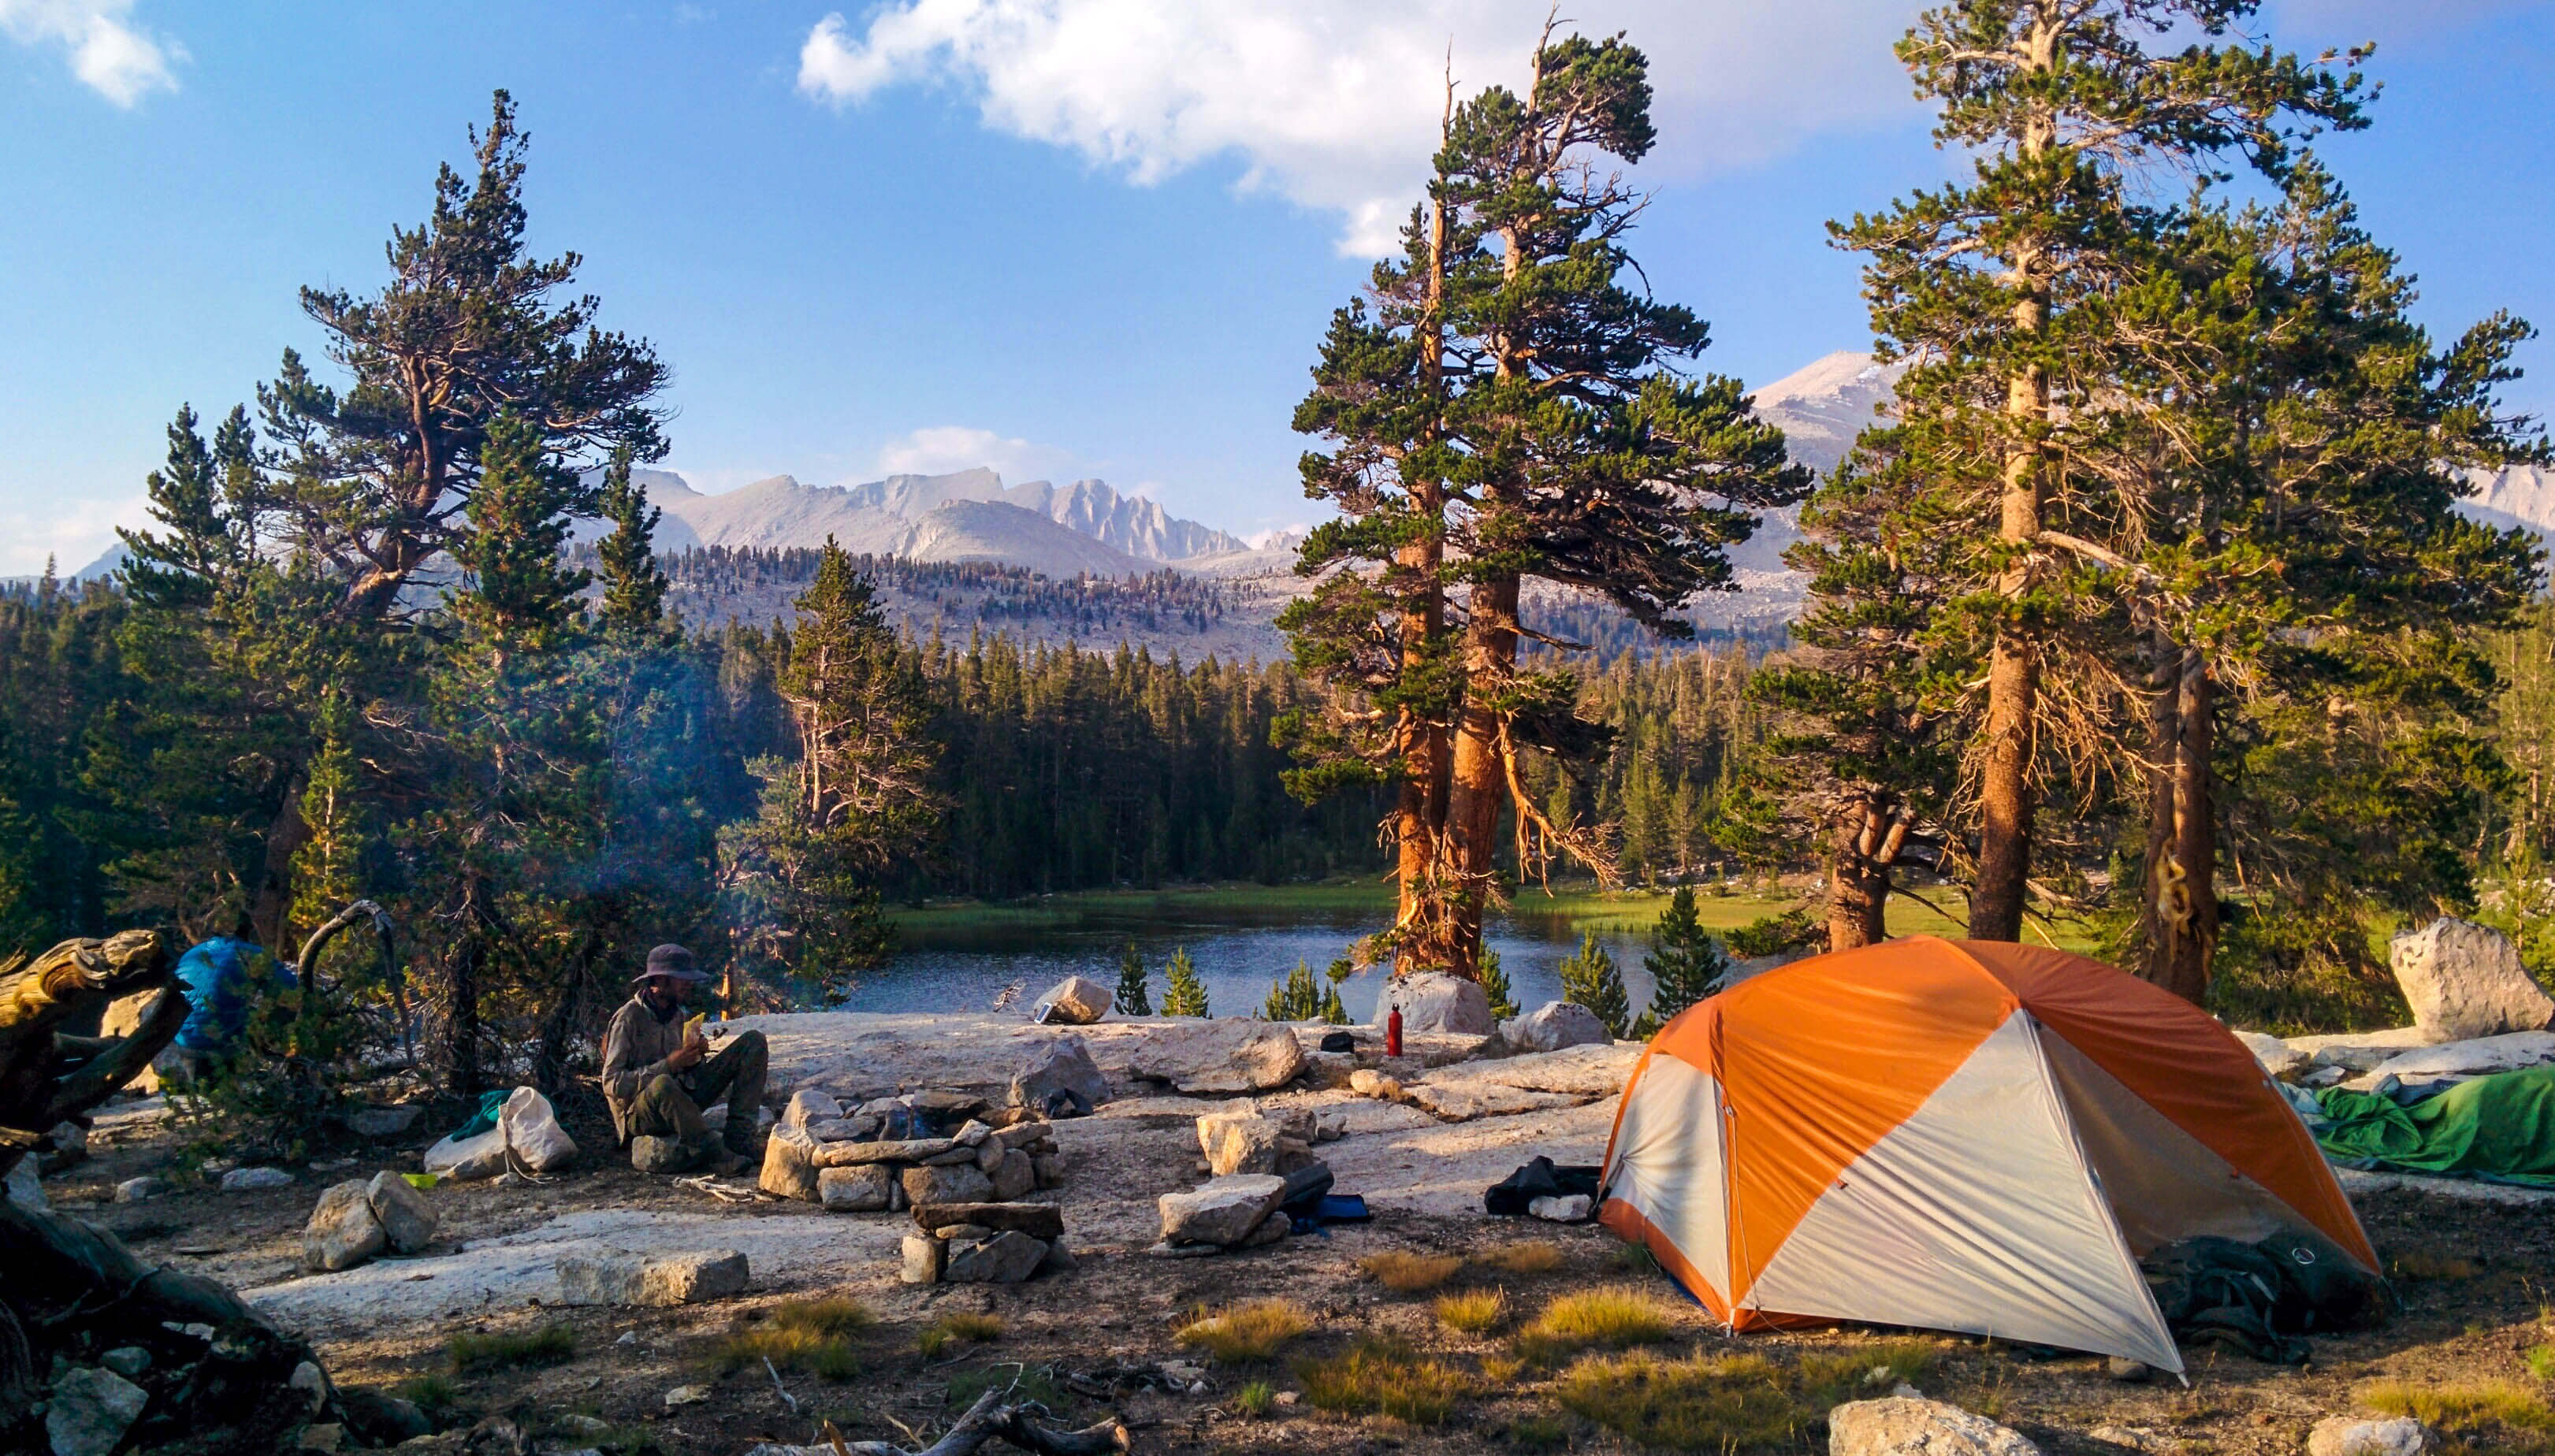
Backpacking
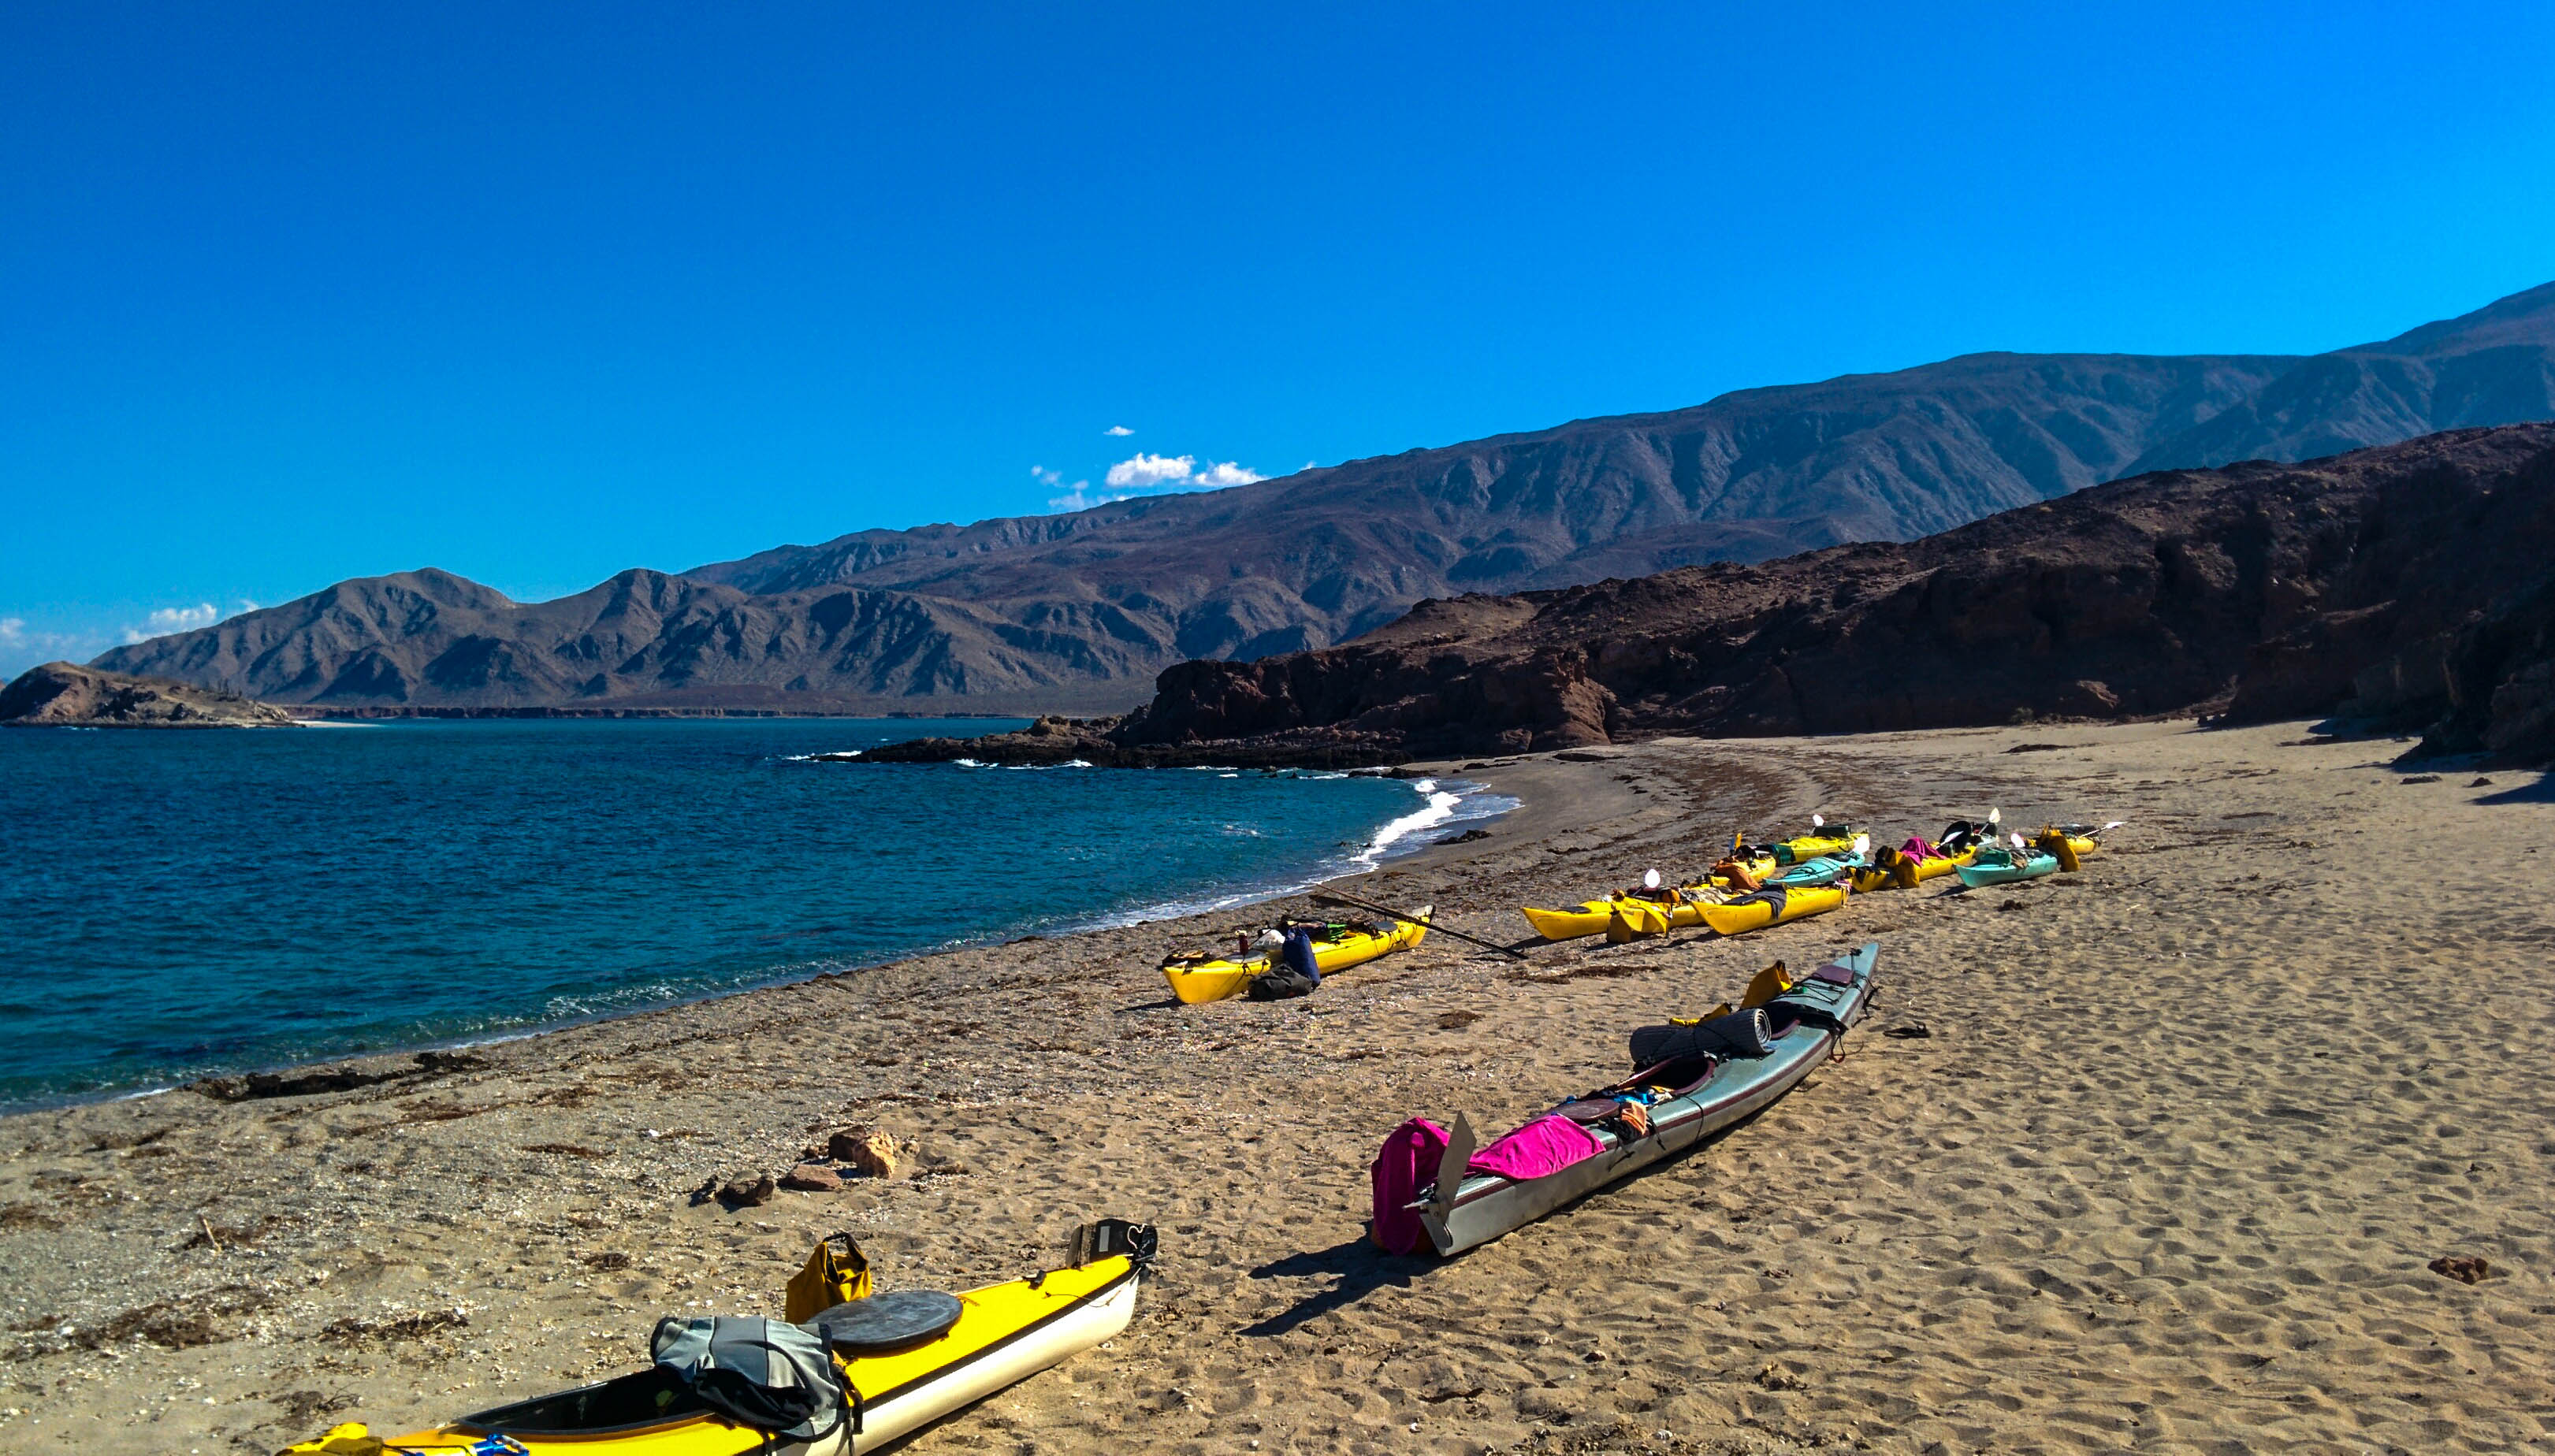
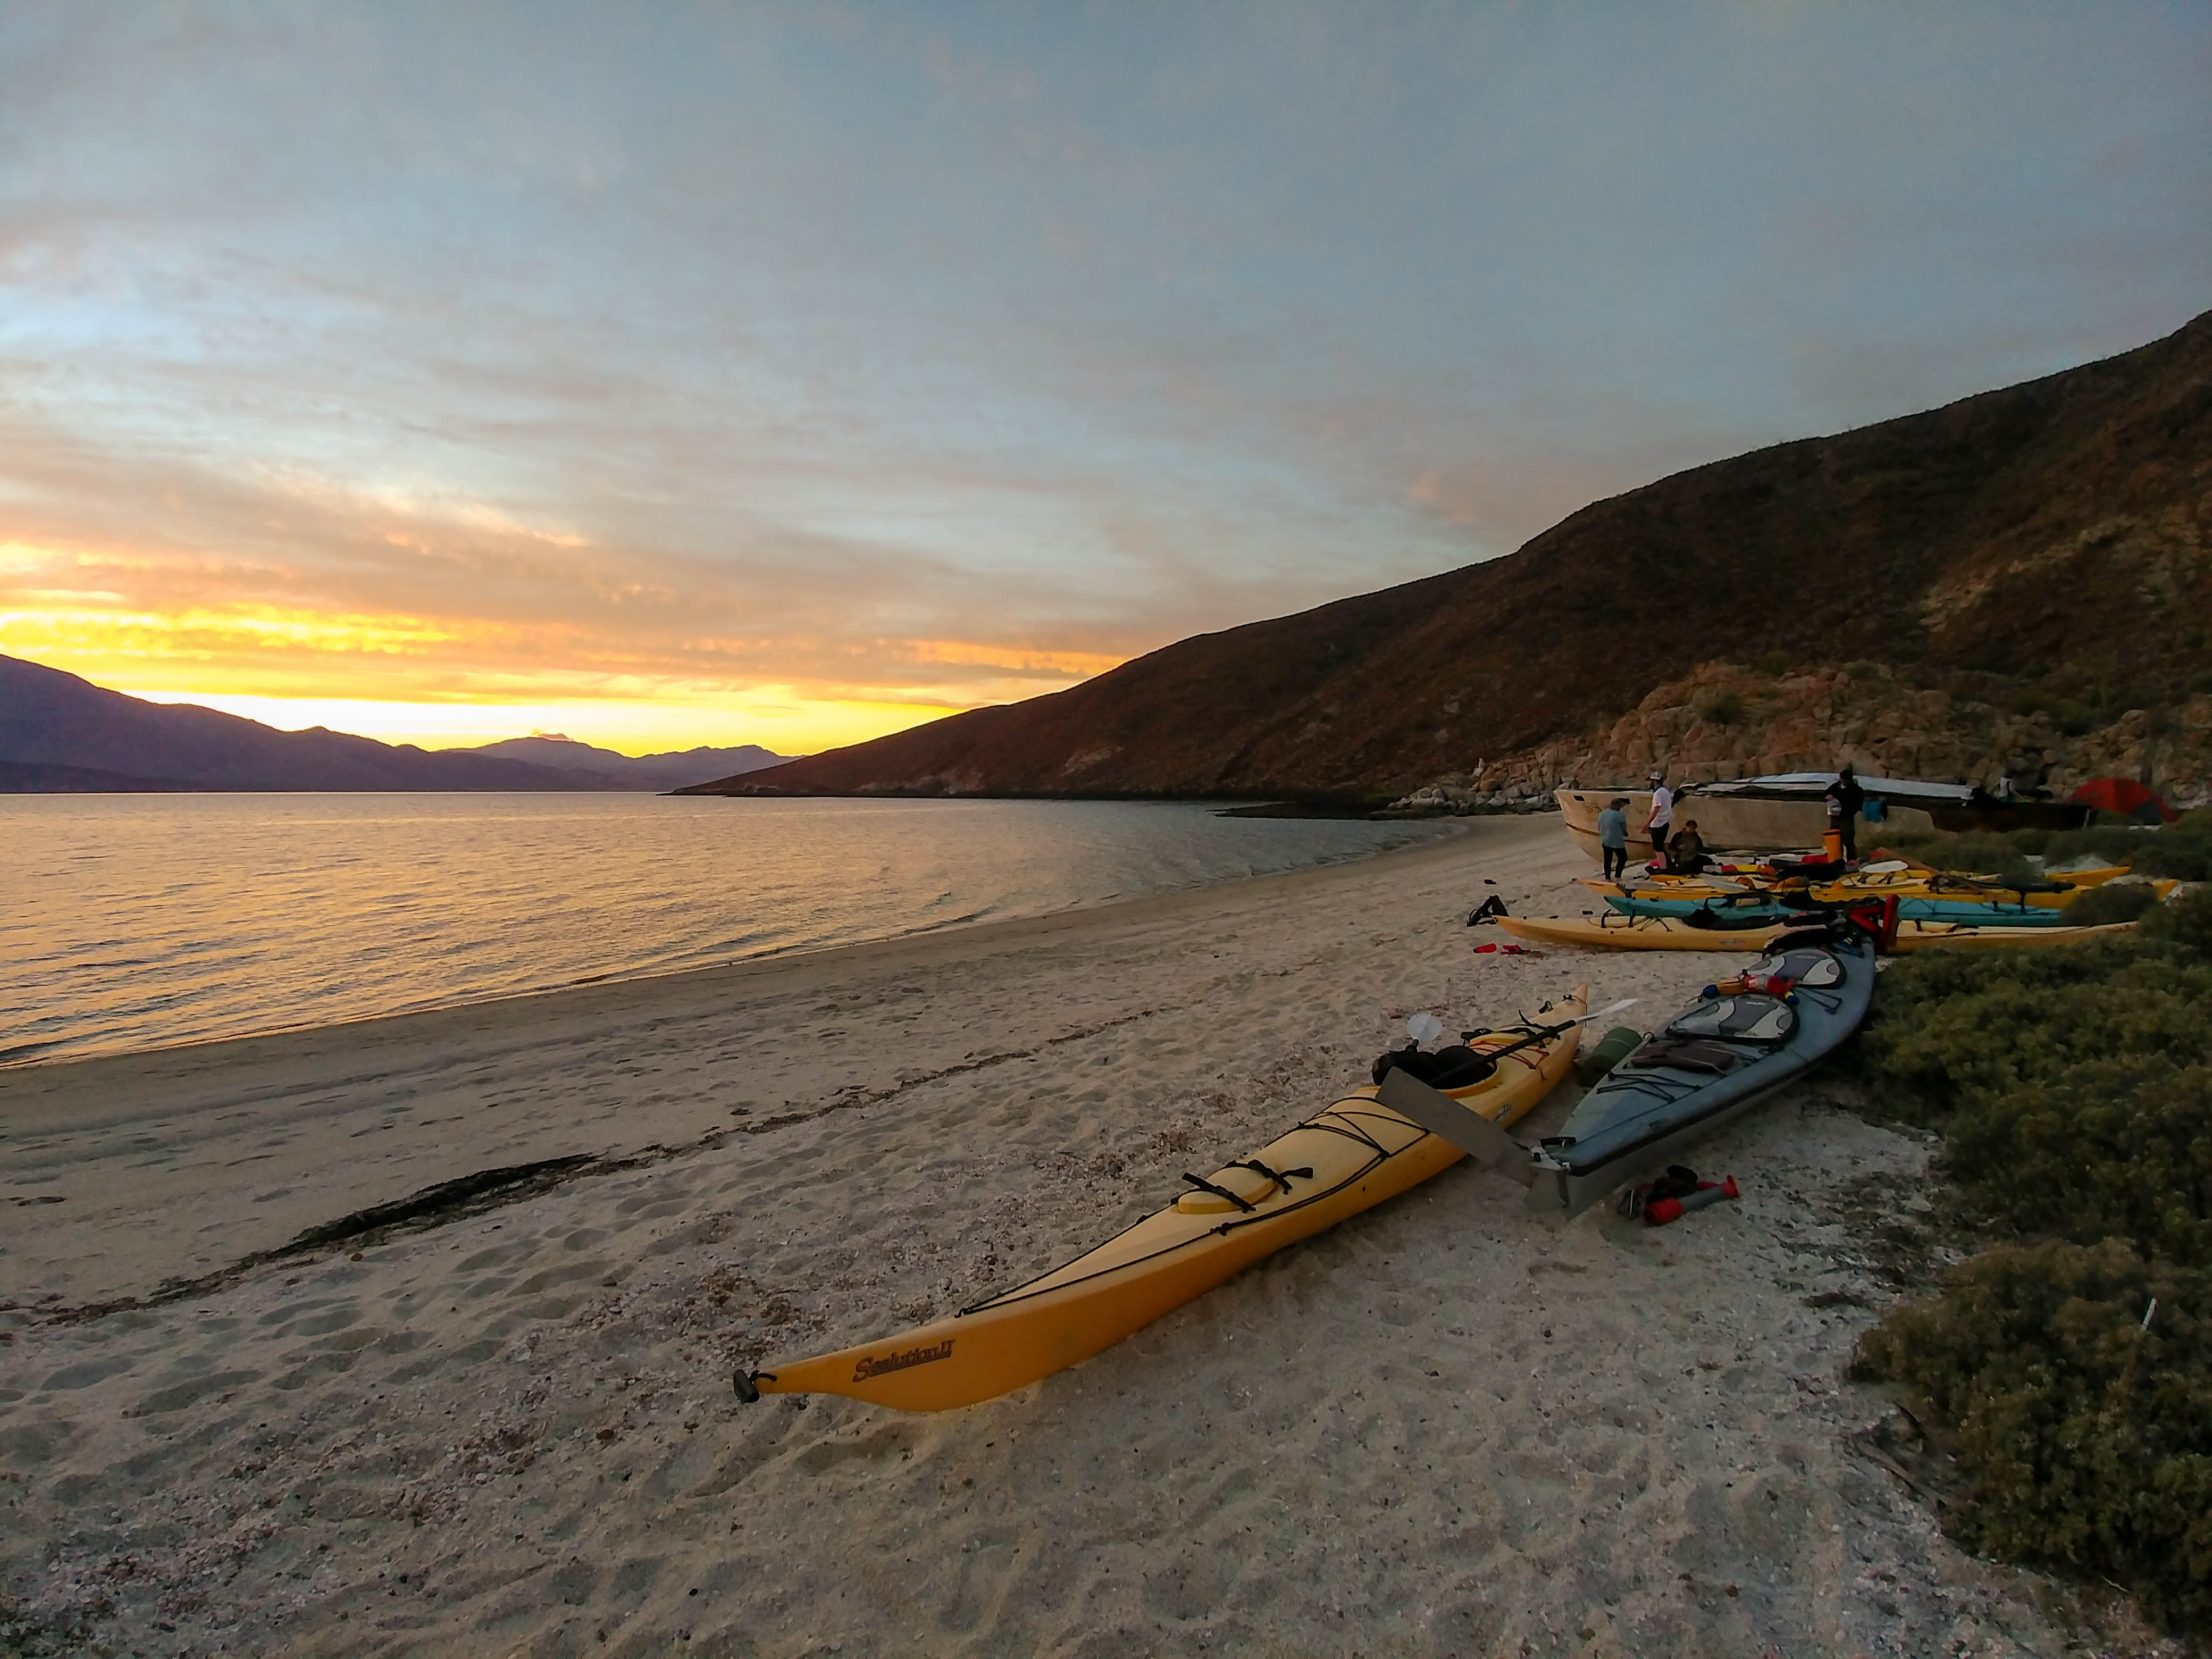
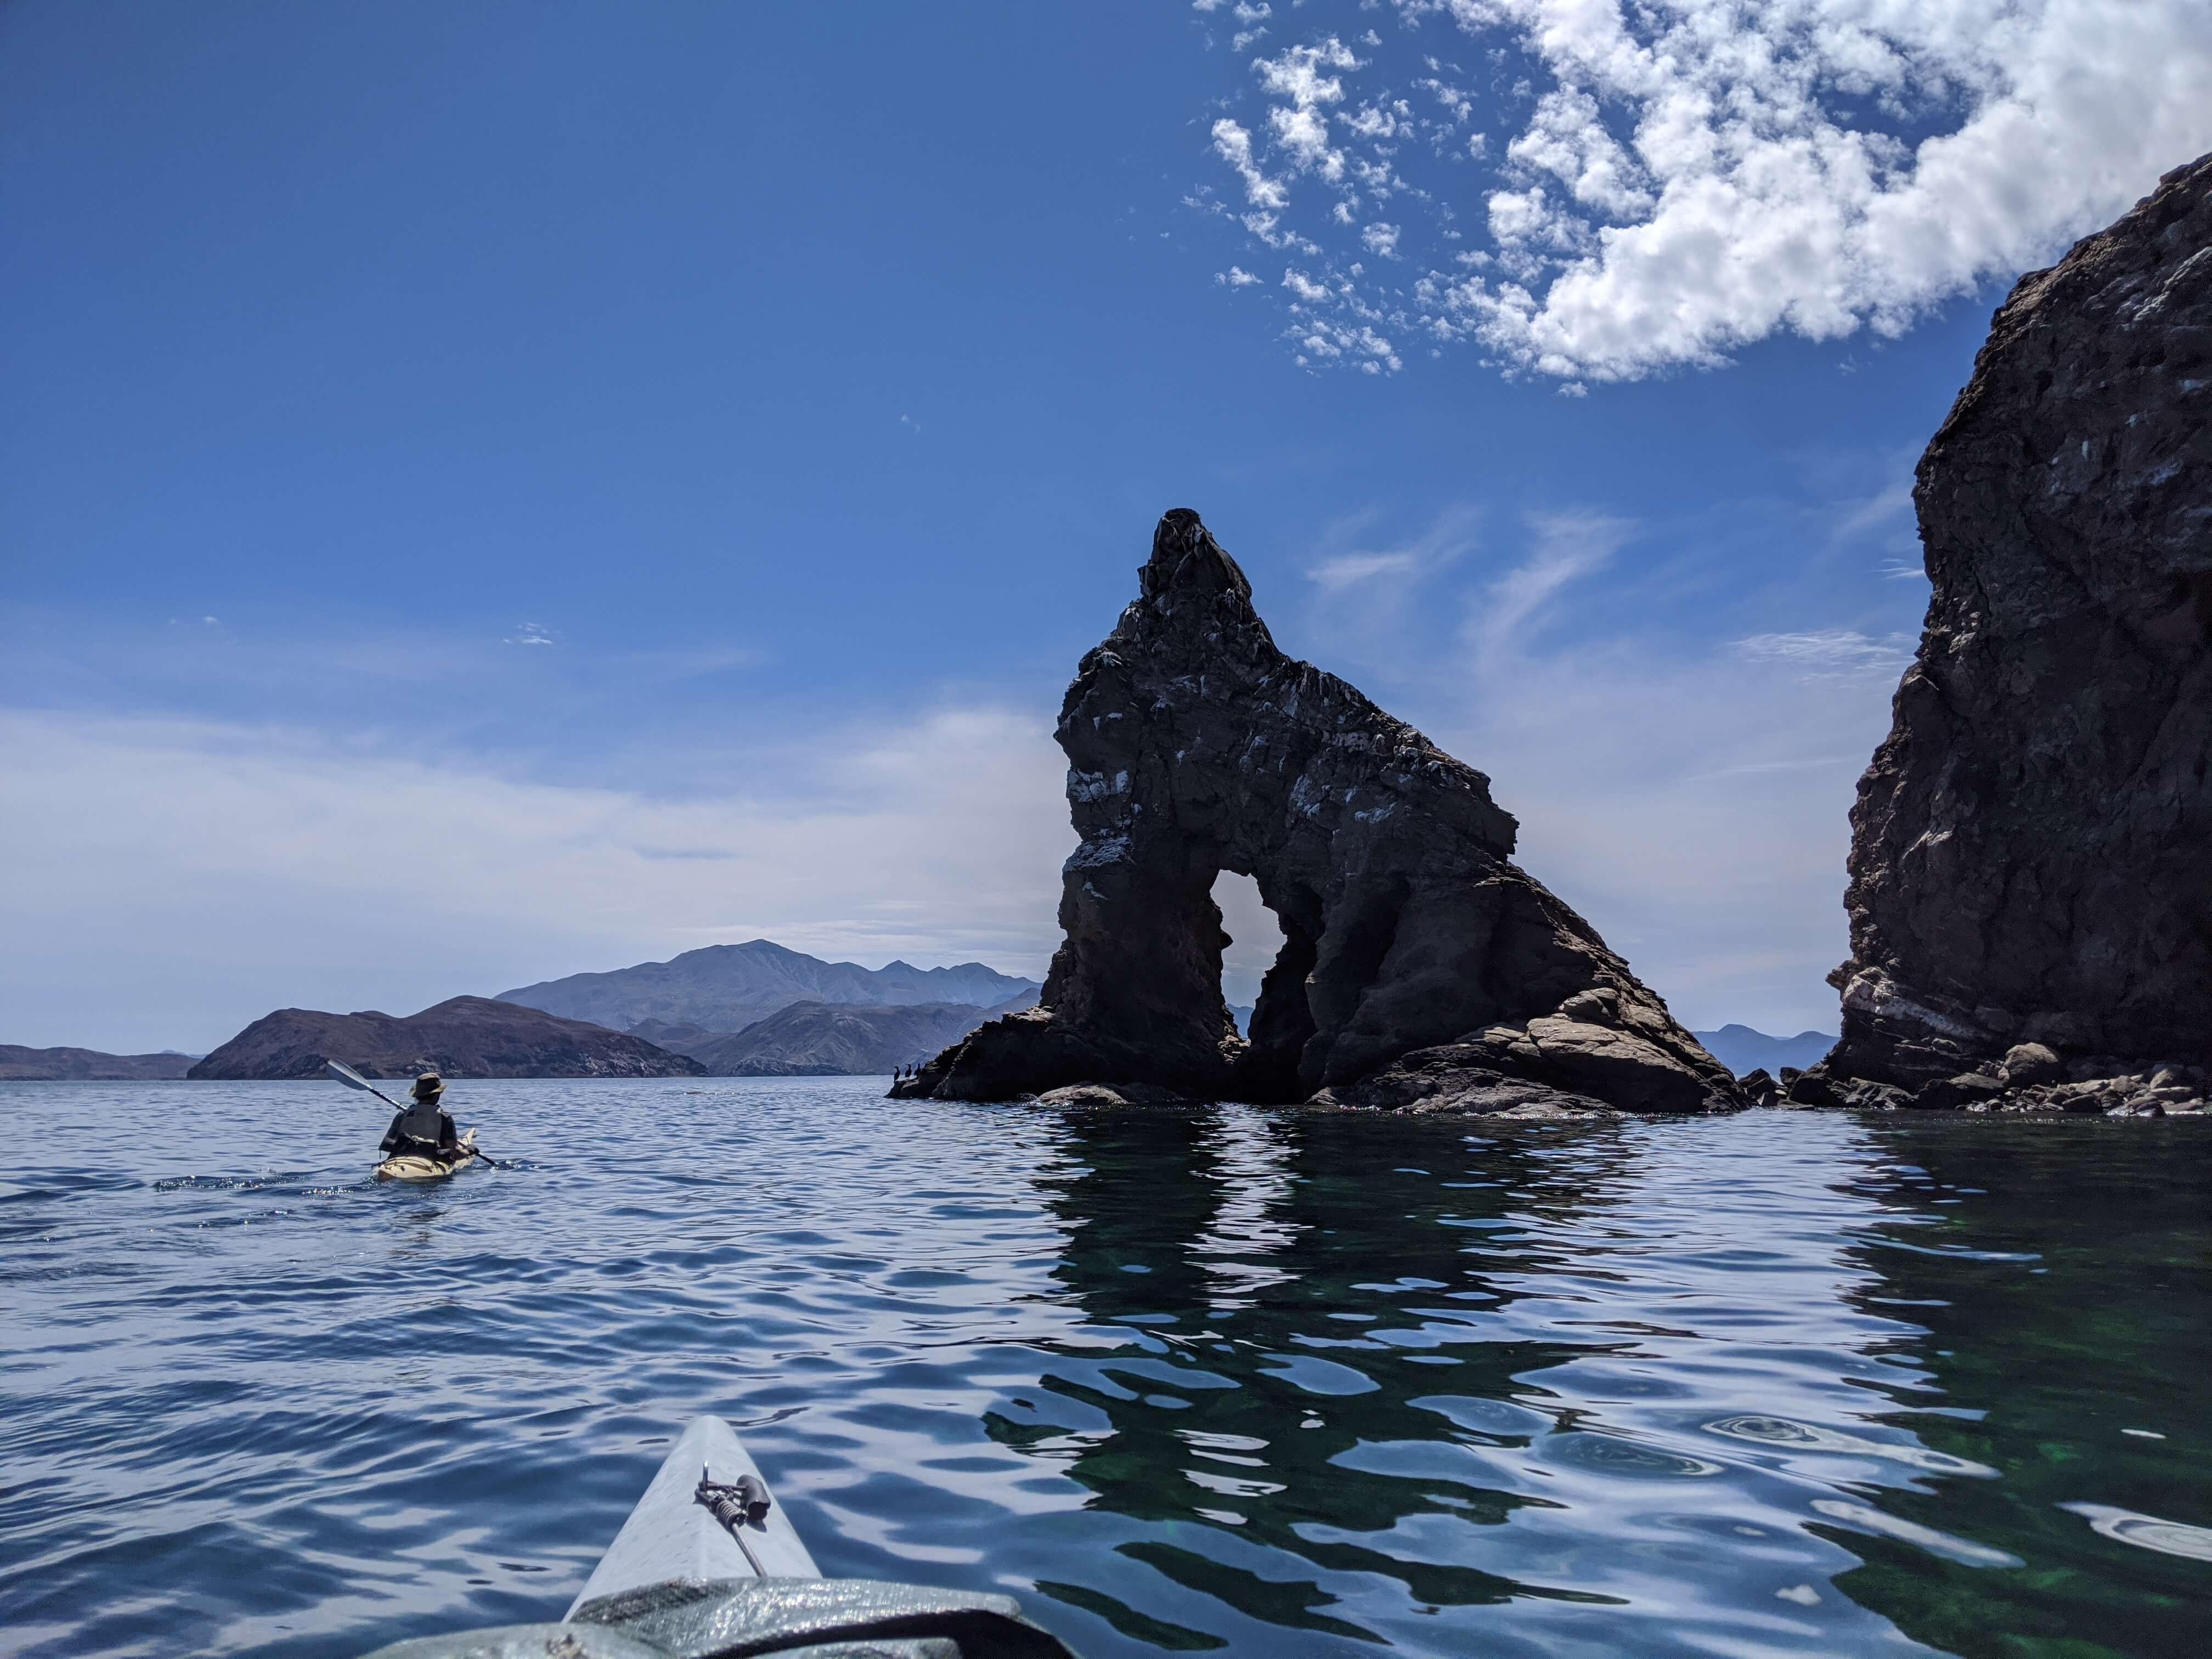
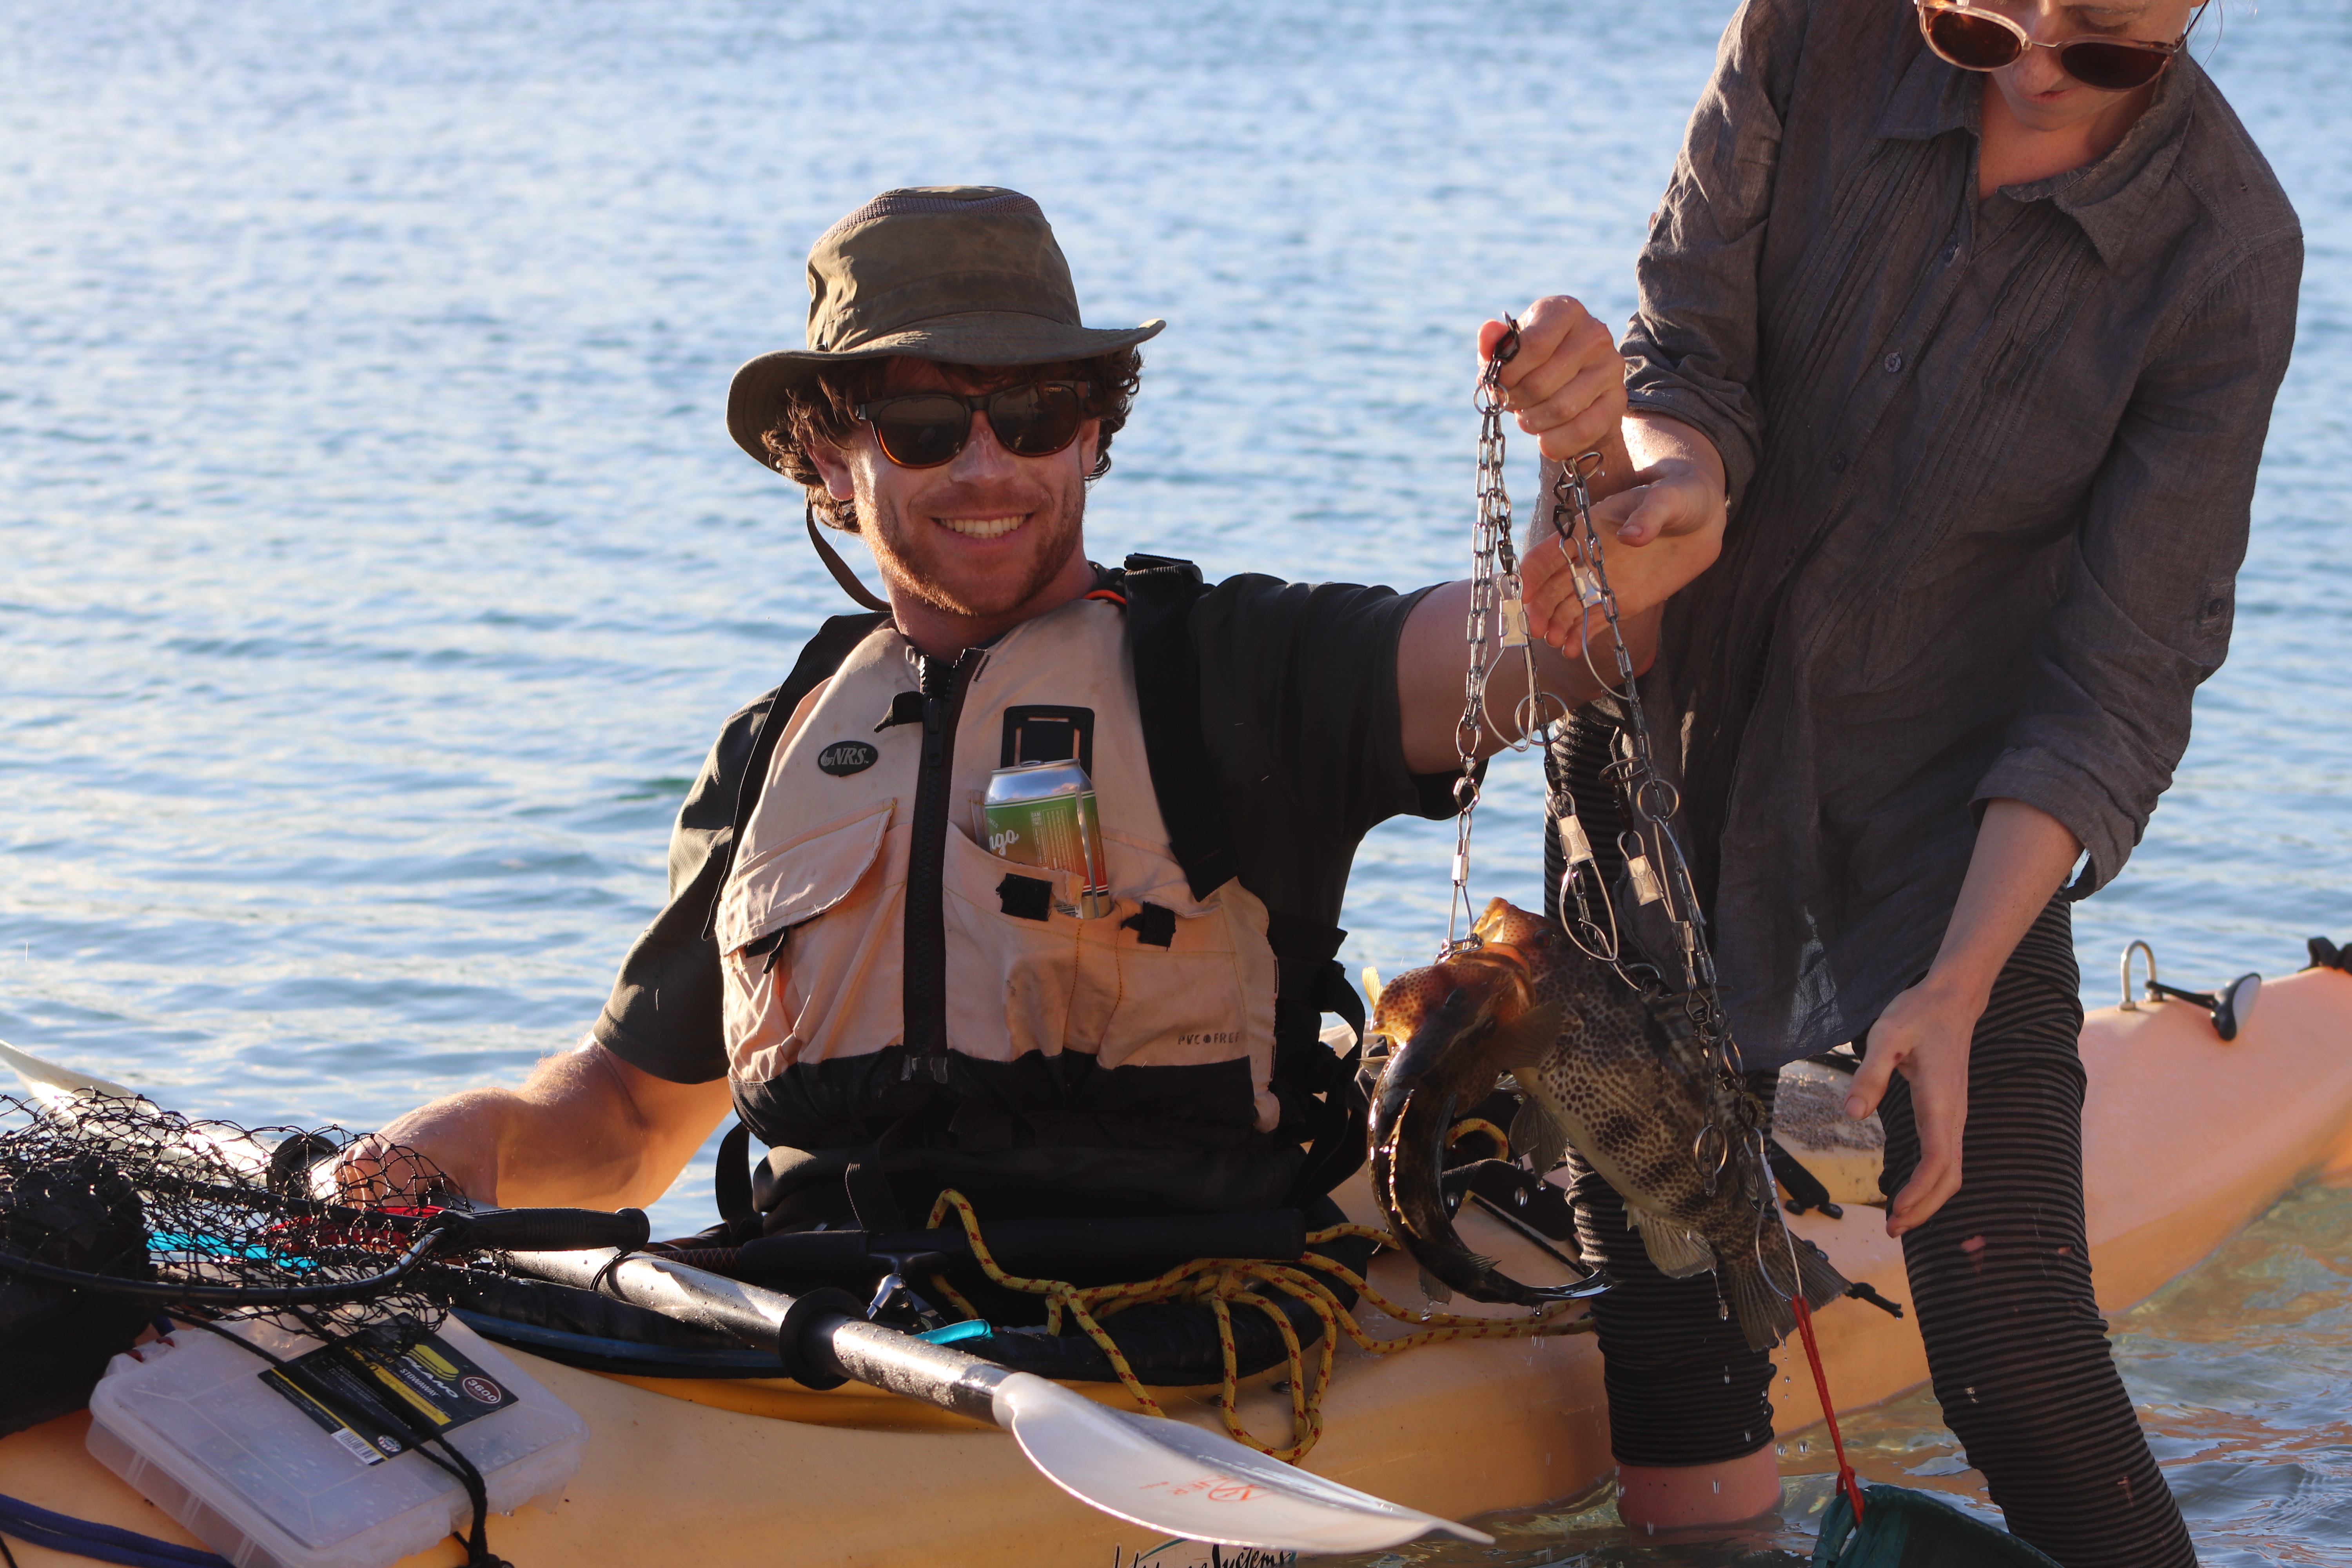
Sea Kayaking

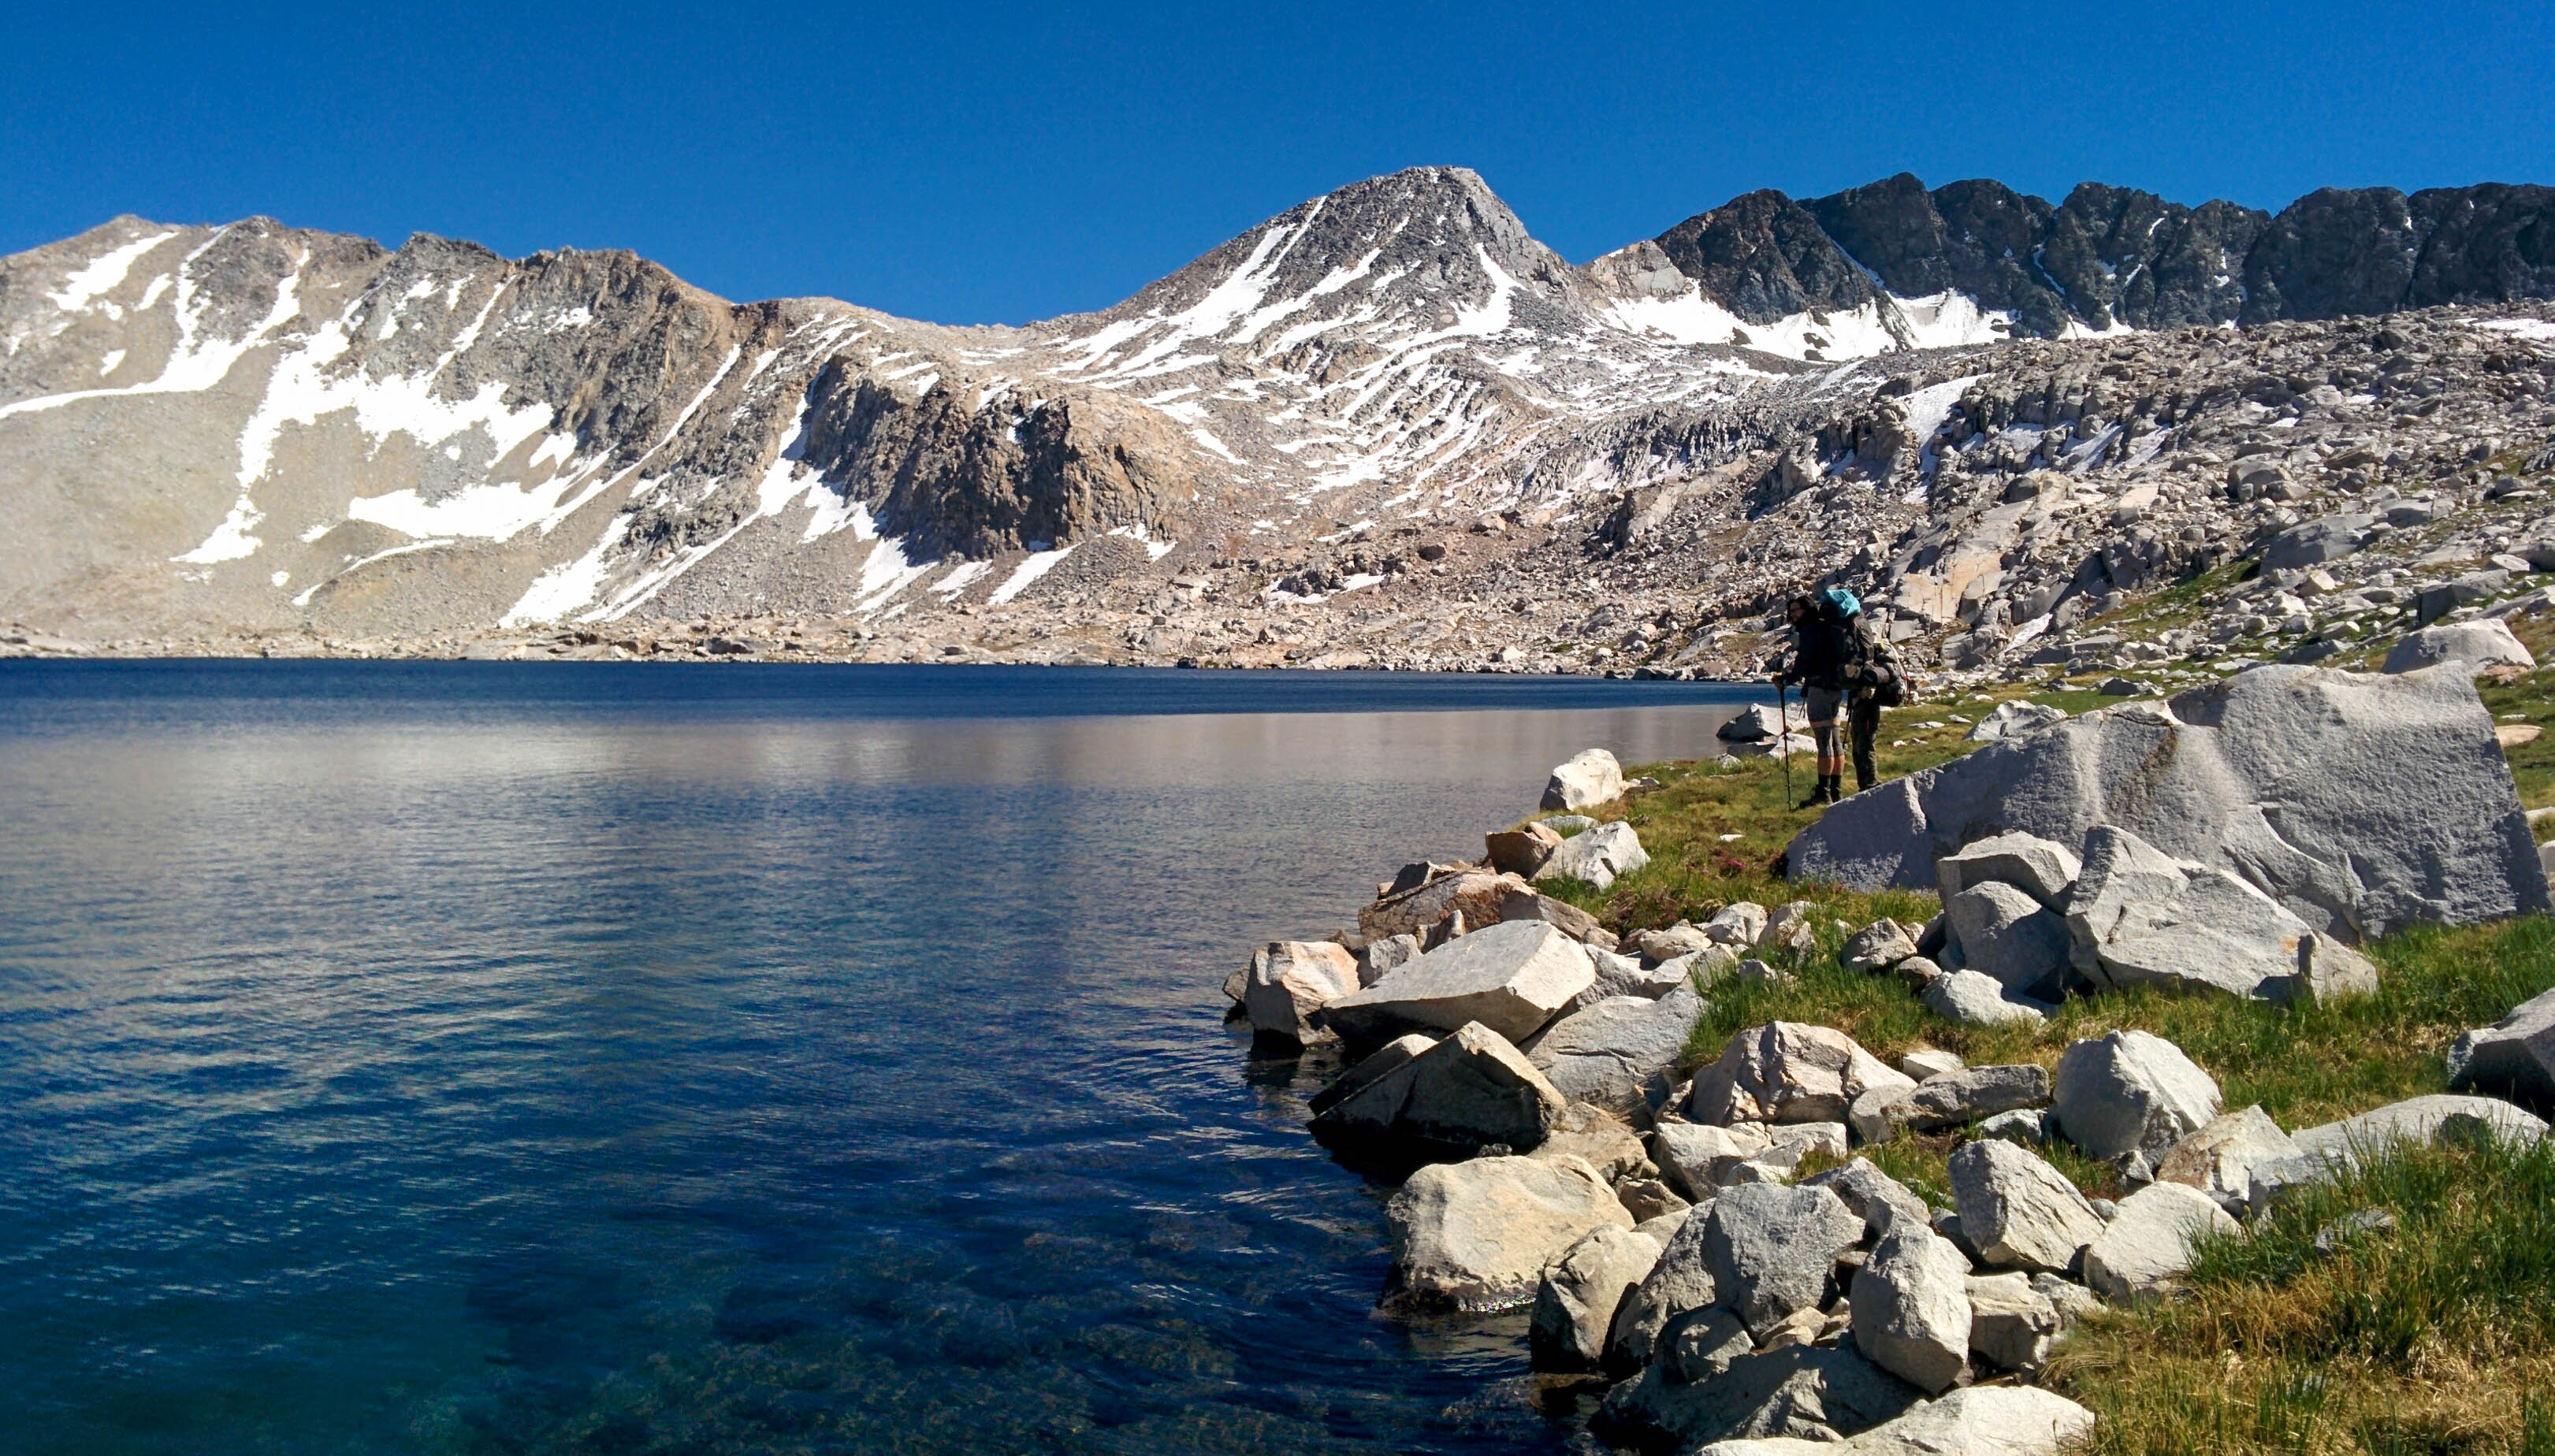
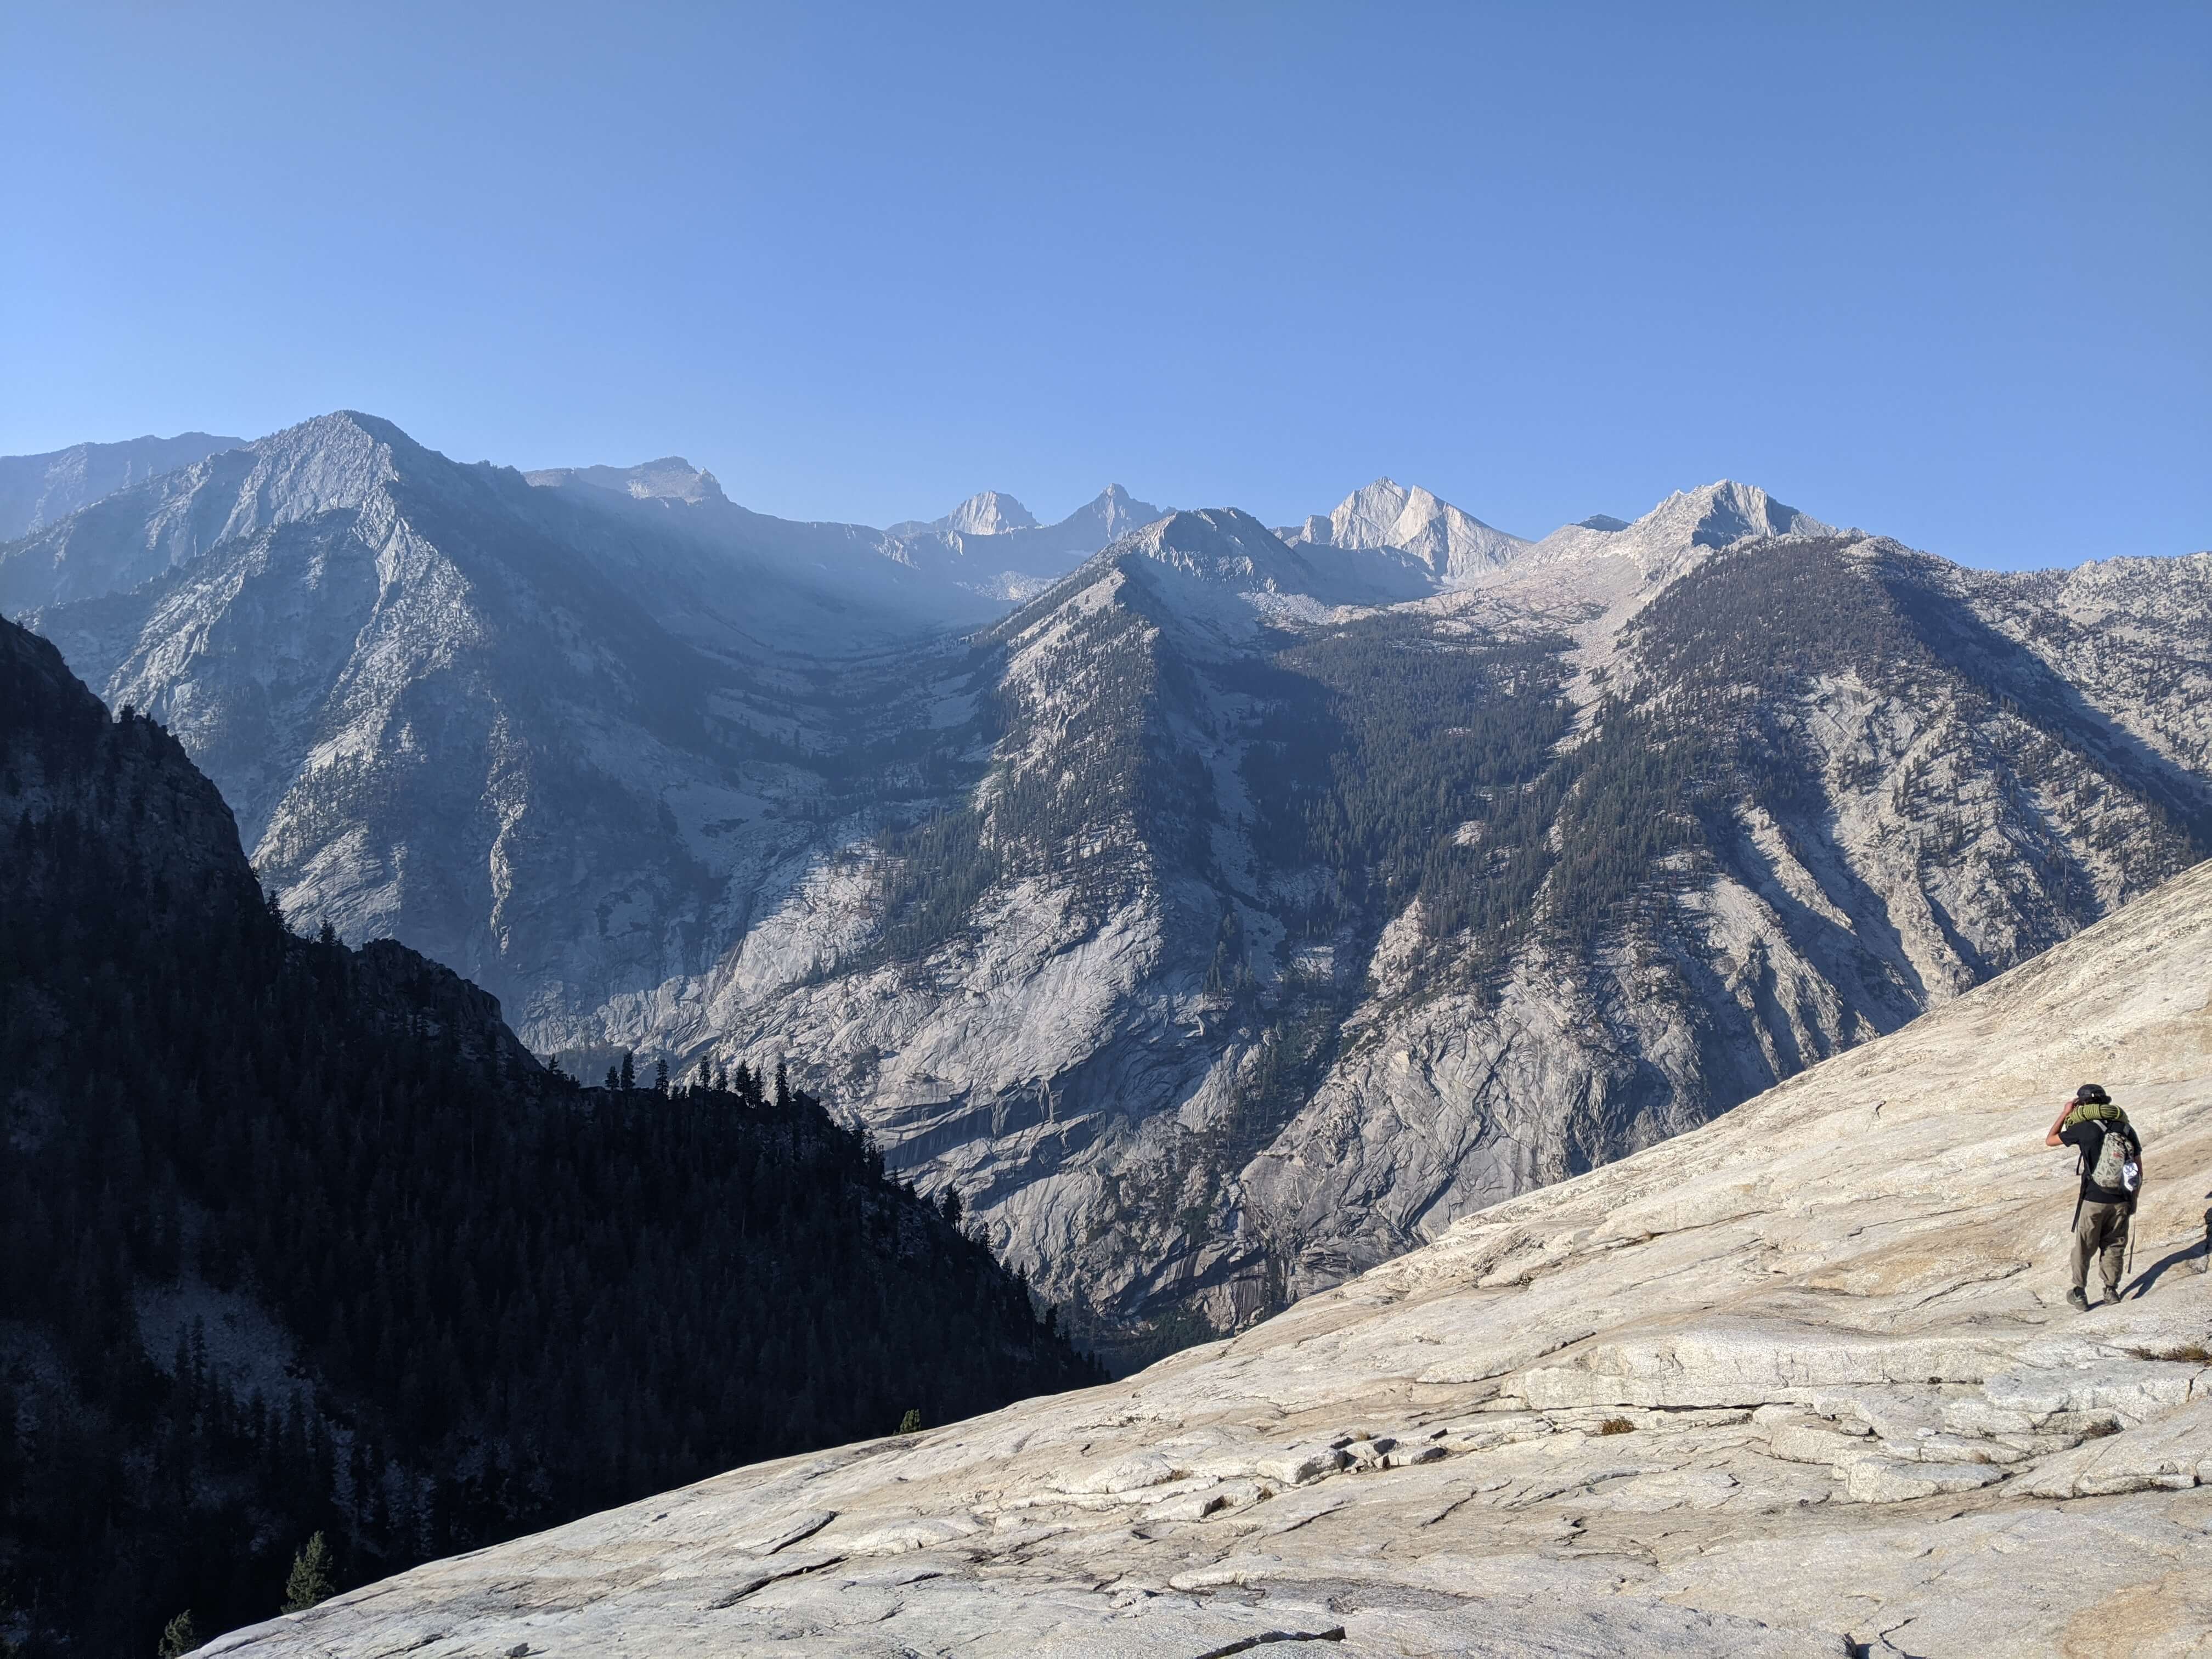
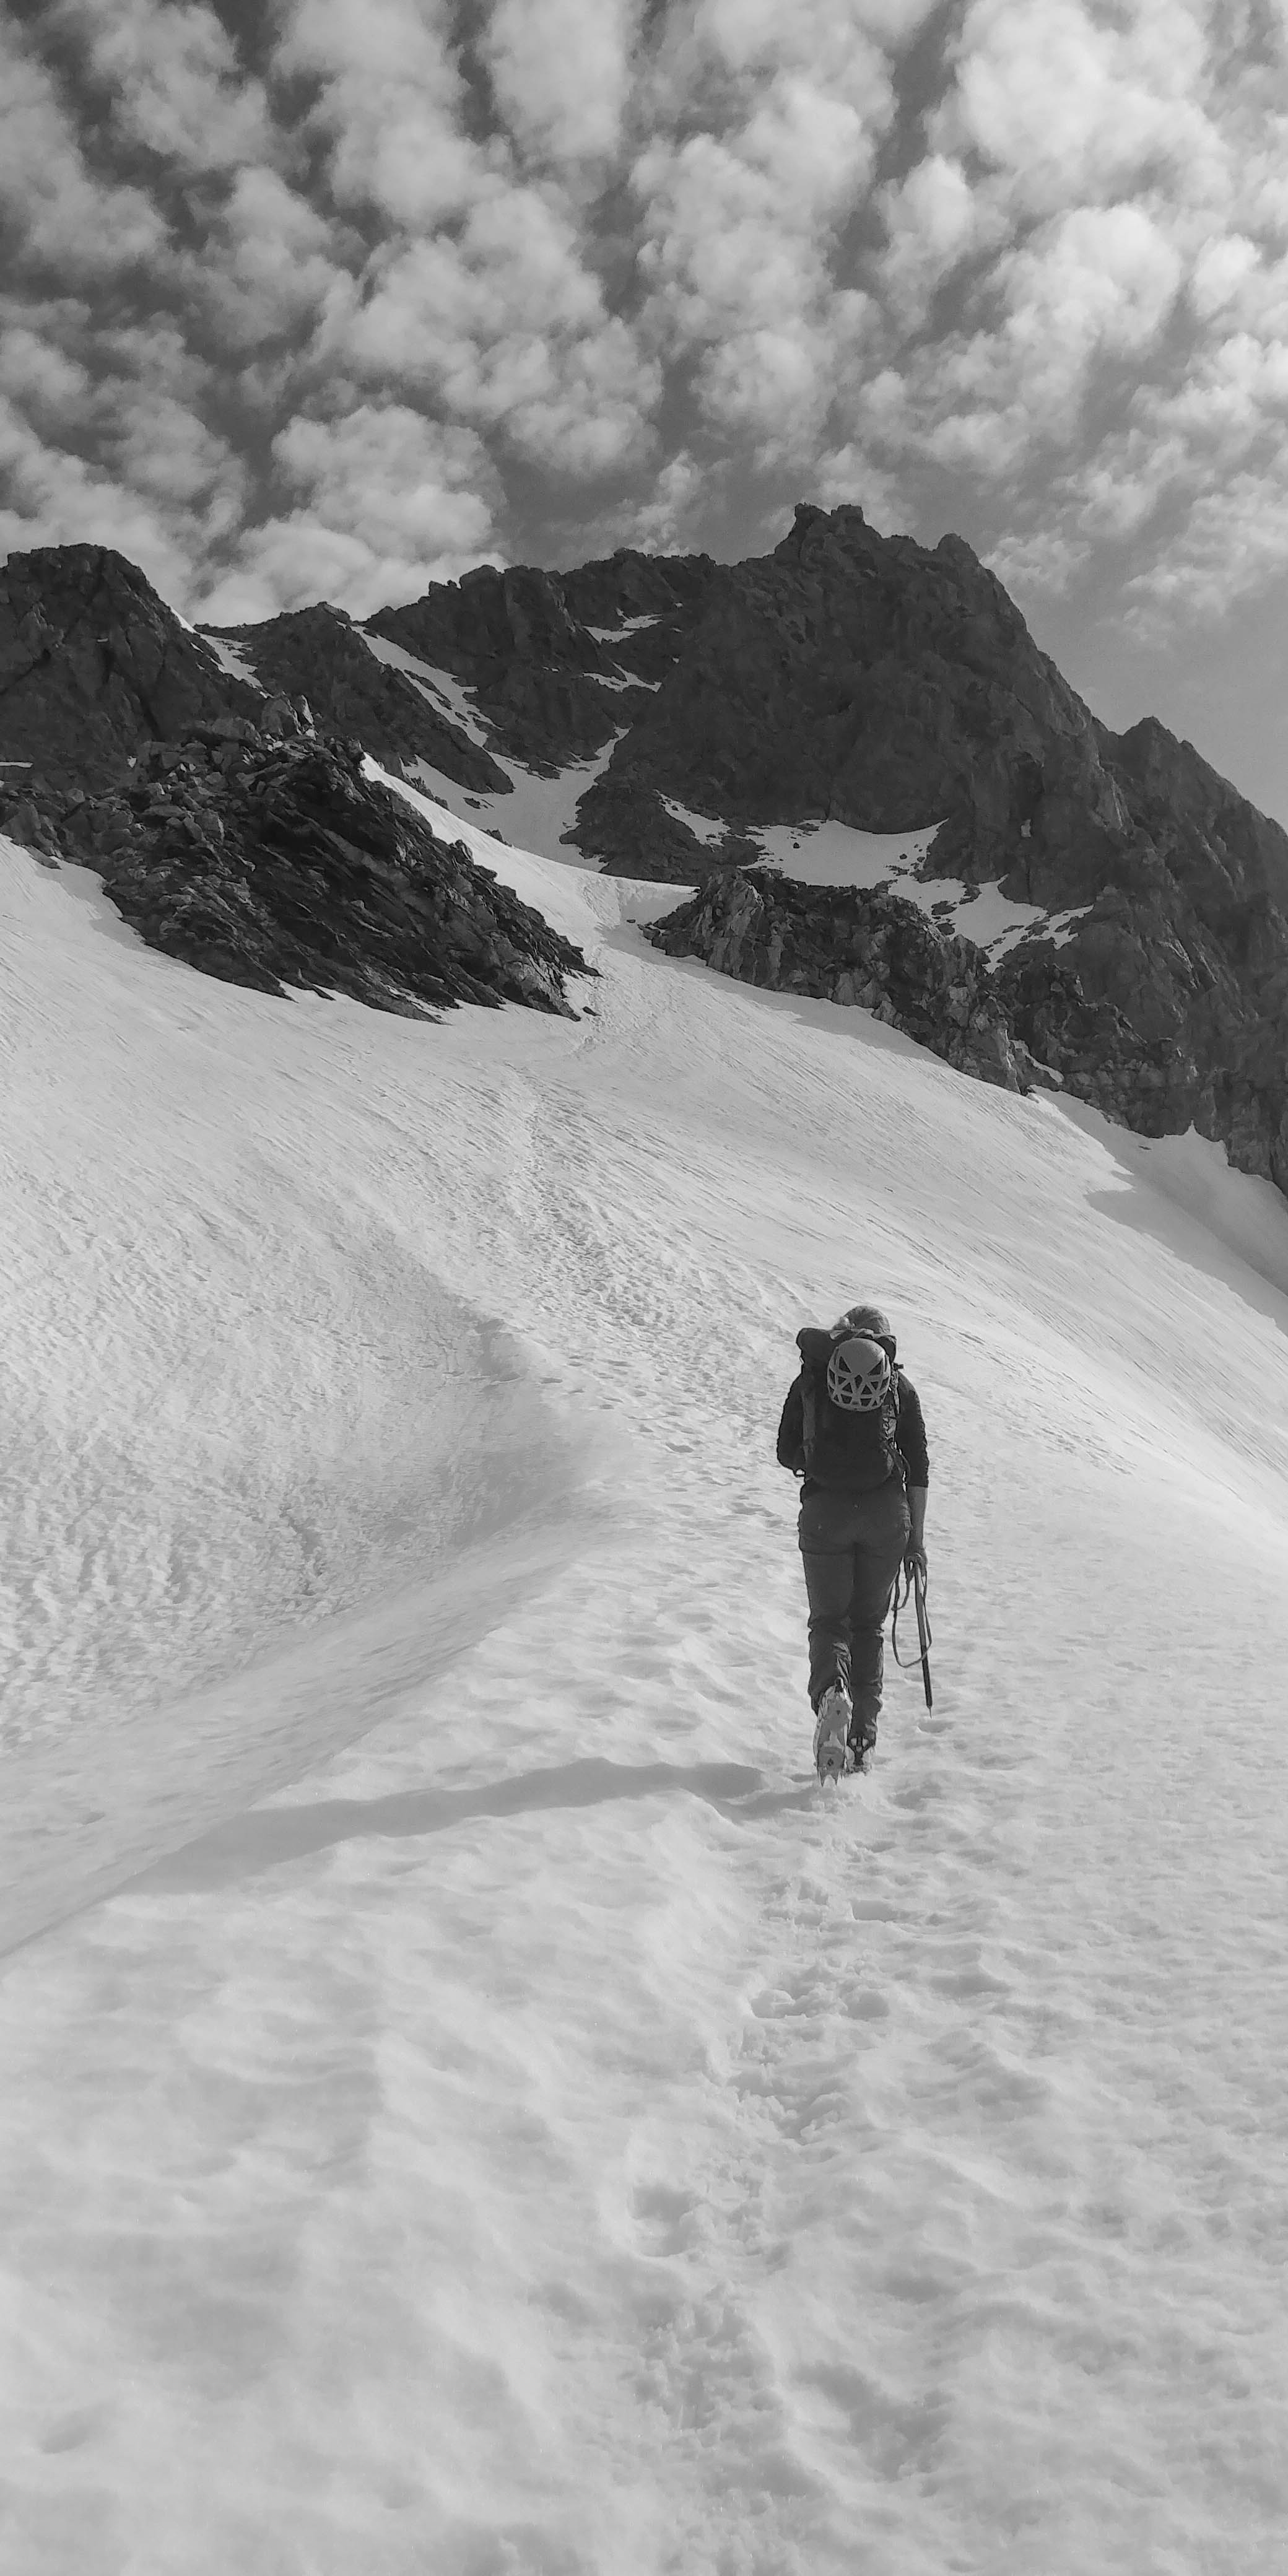
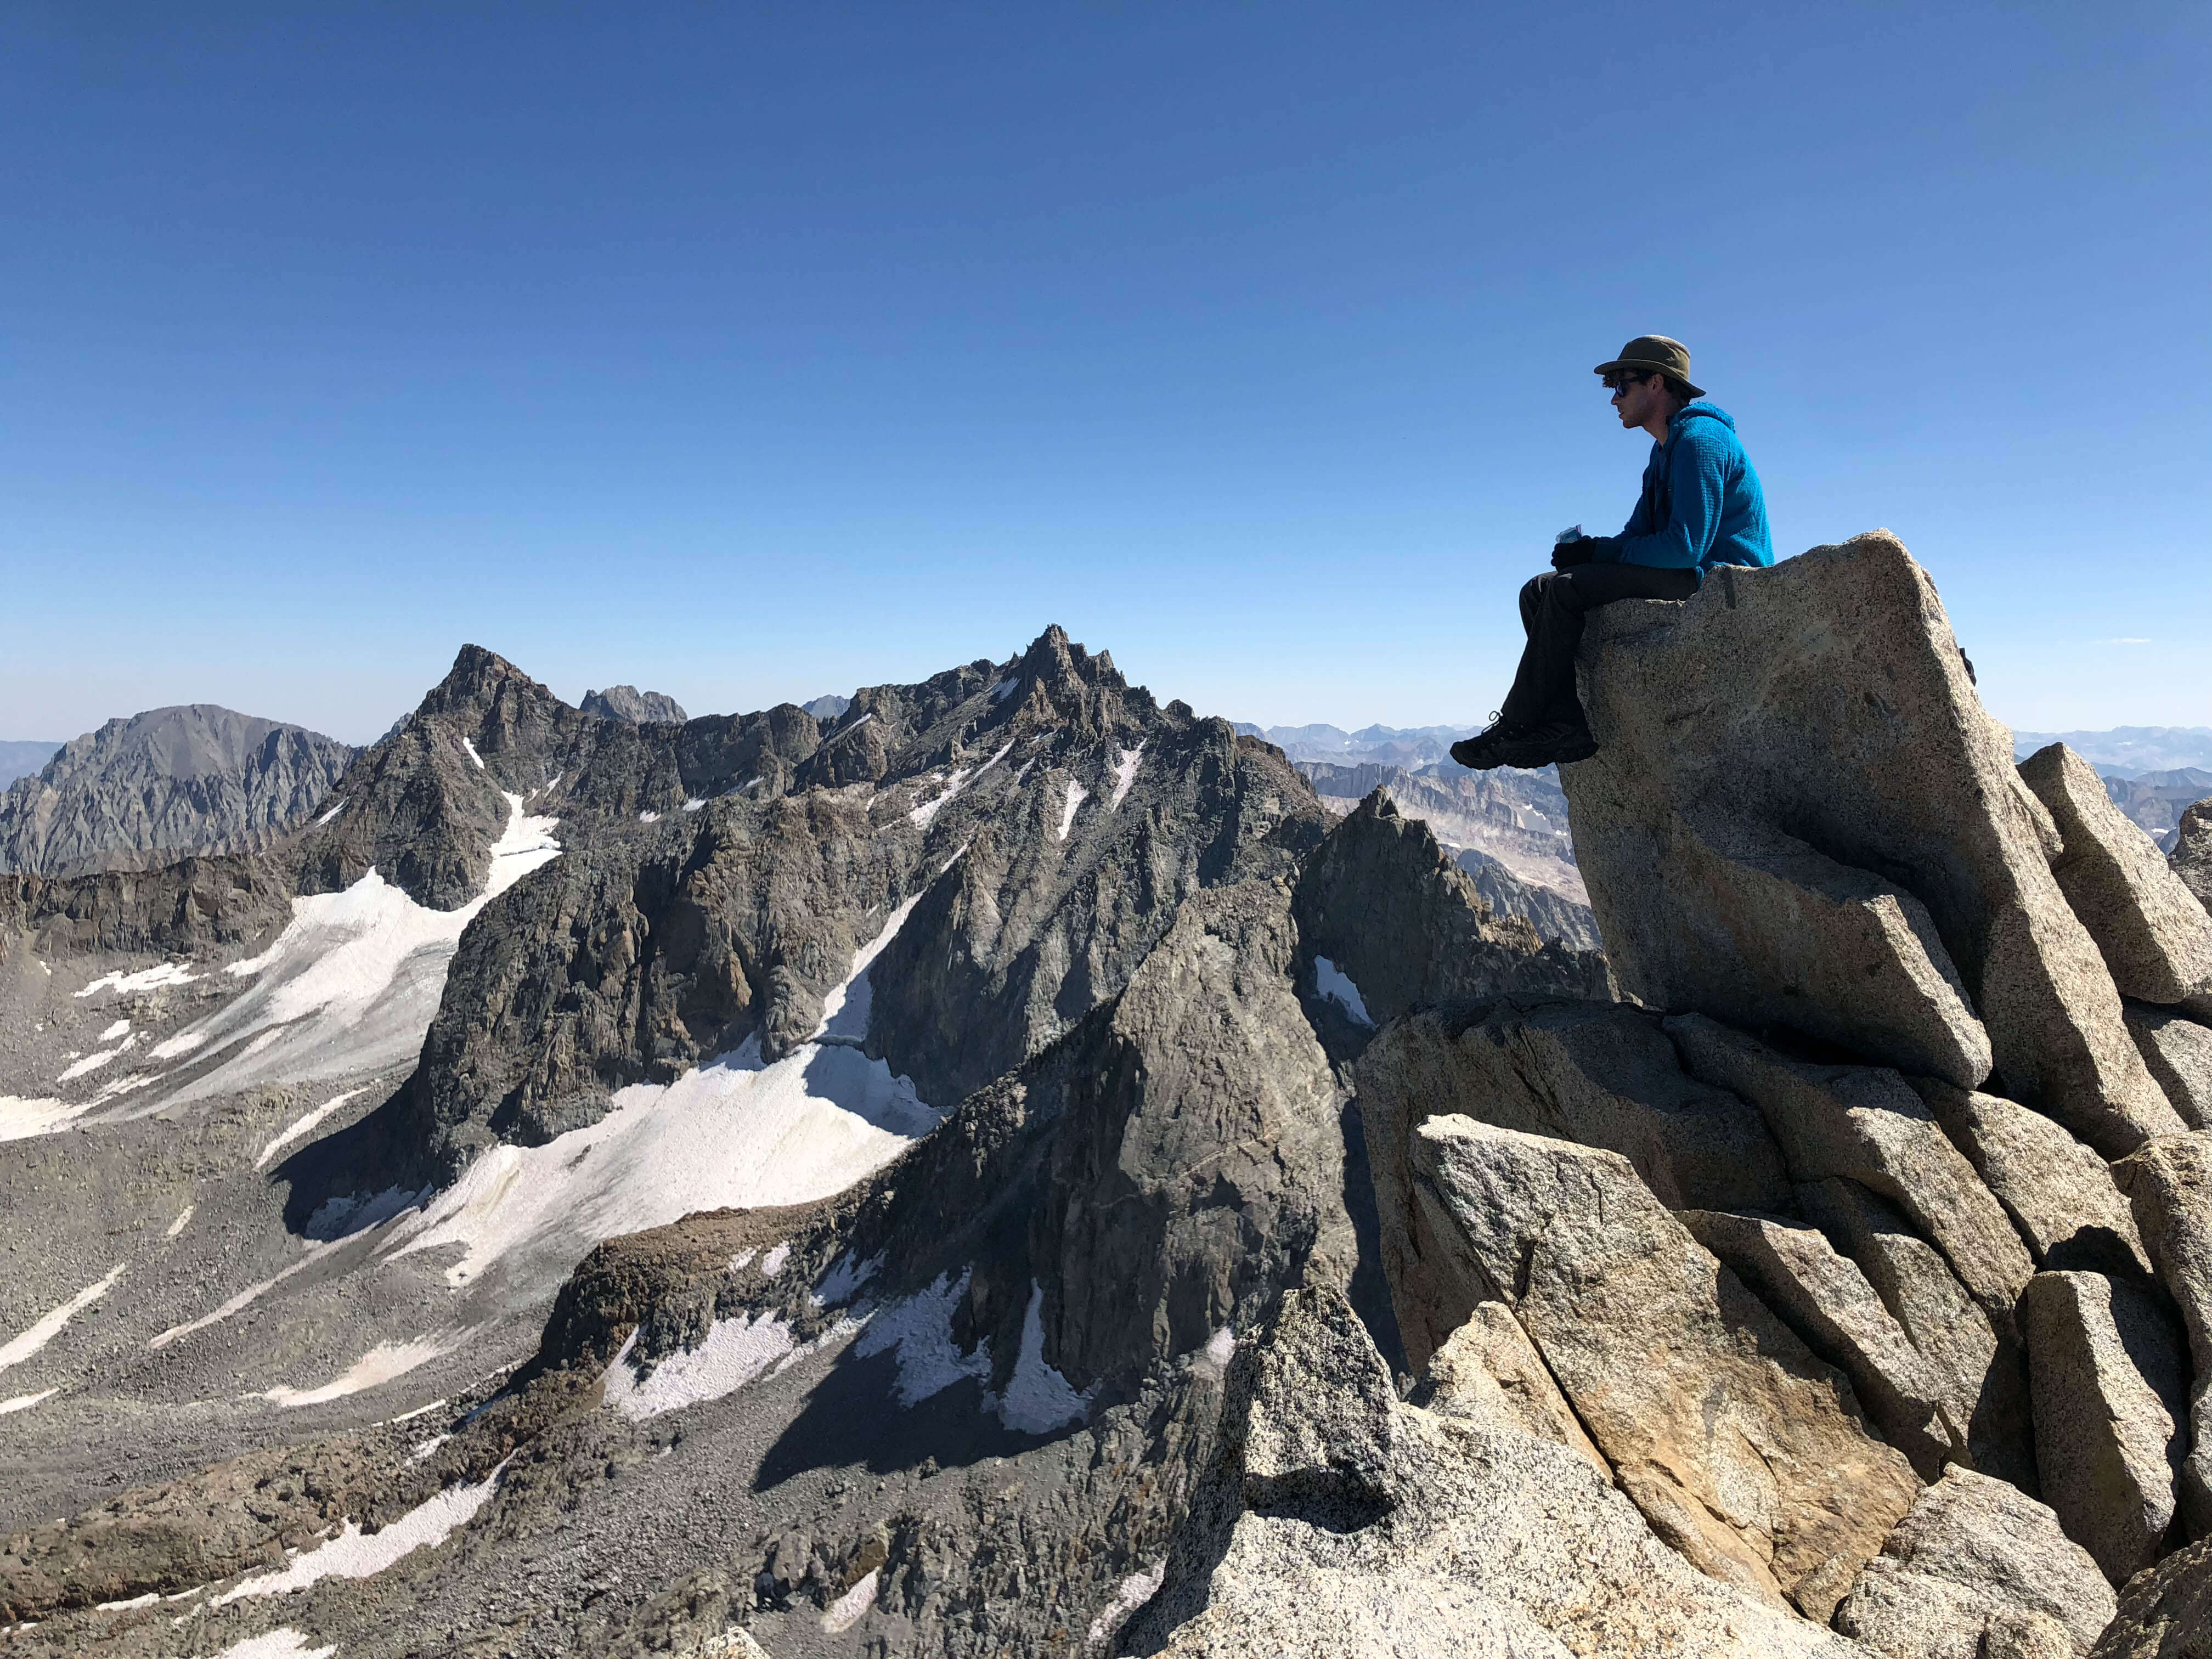
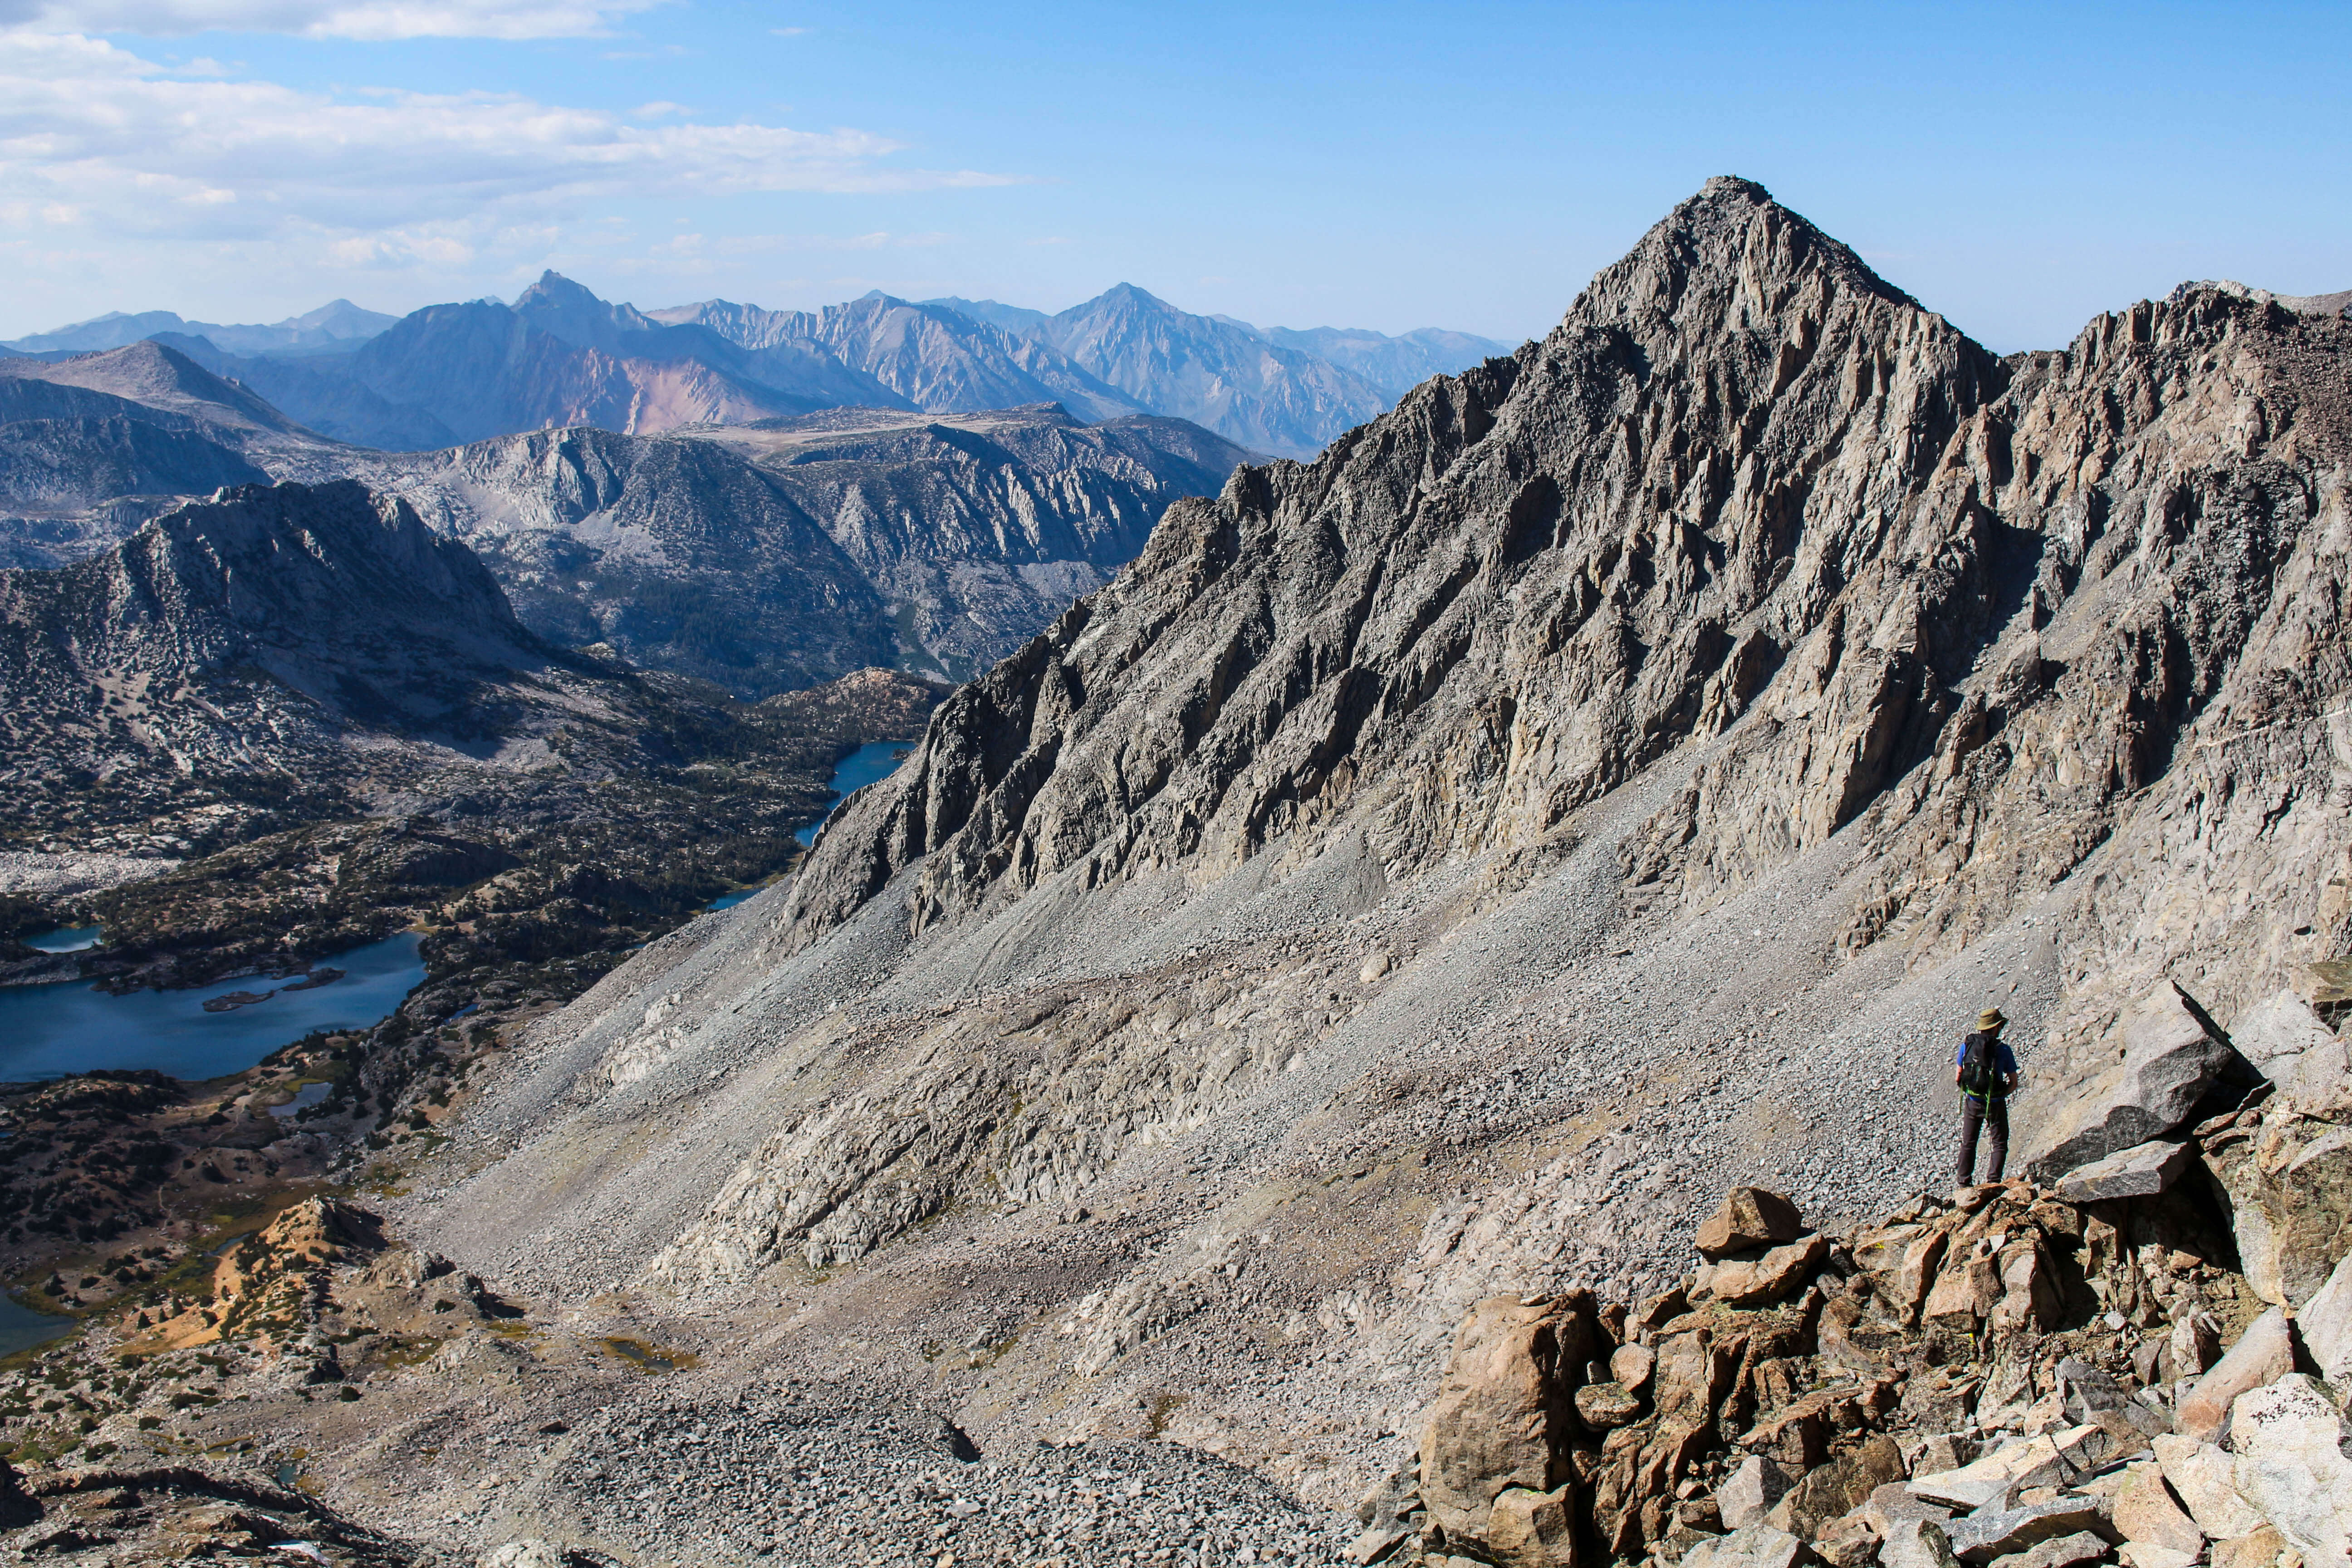
Mountaineering
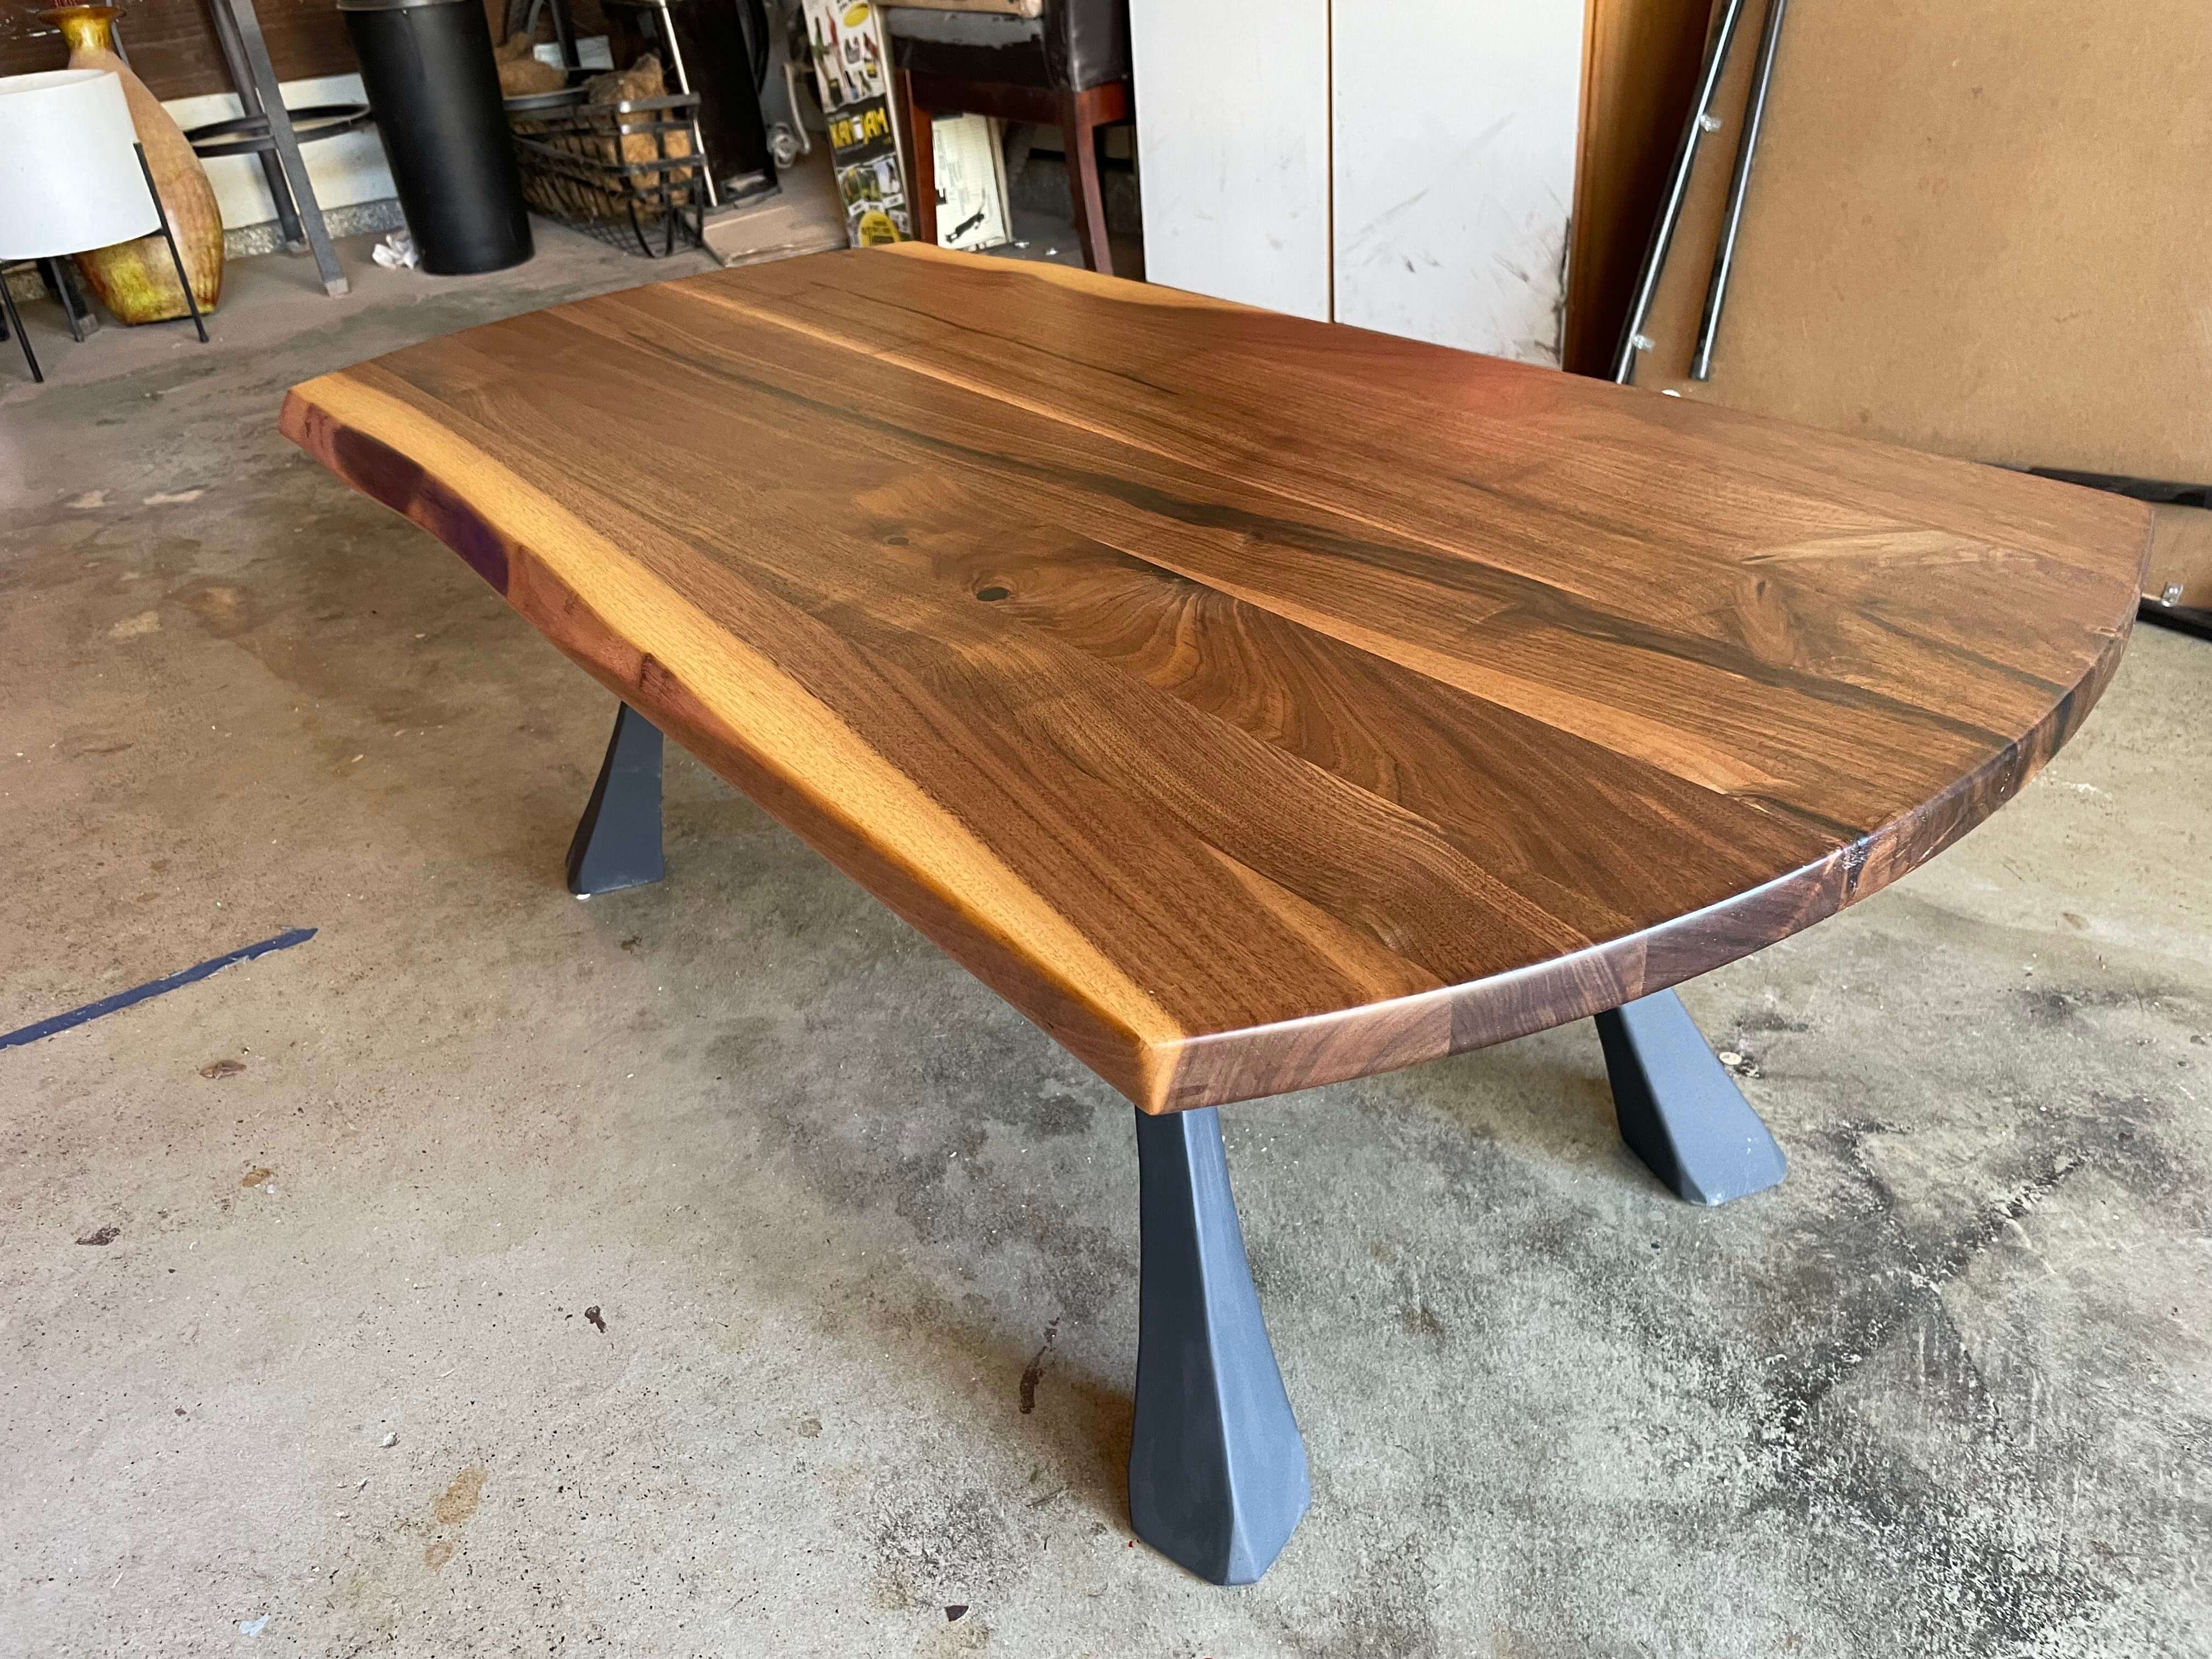
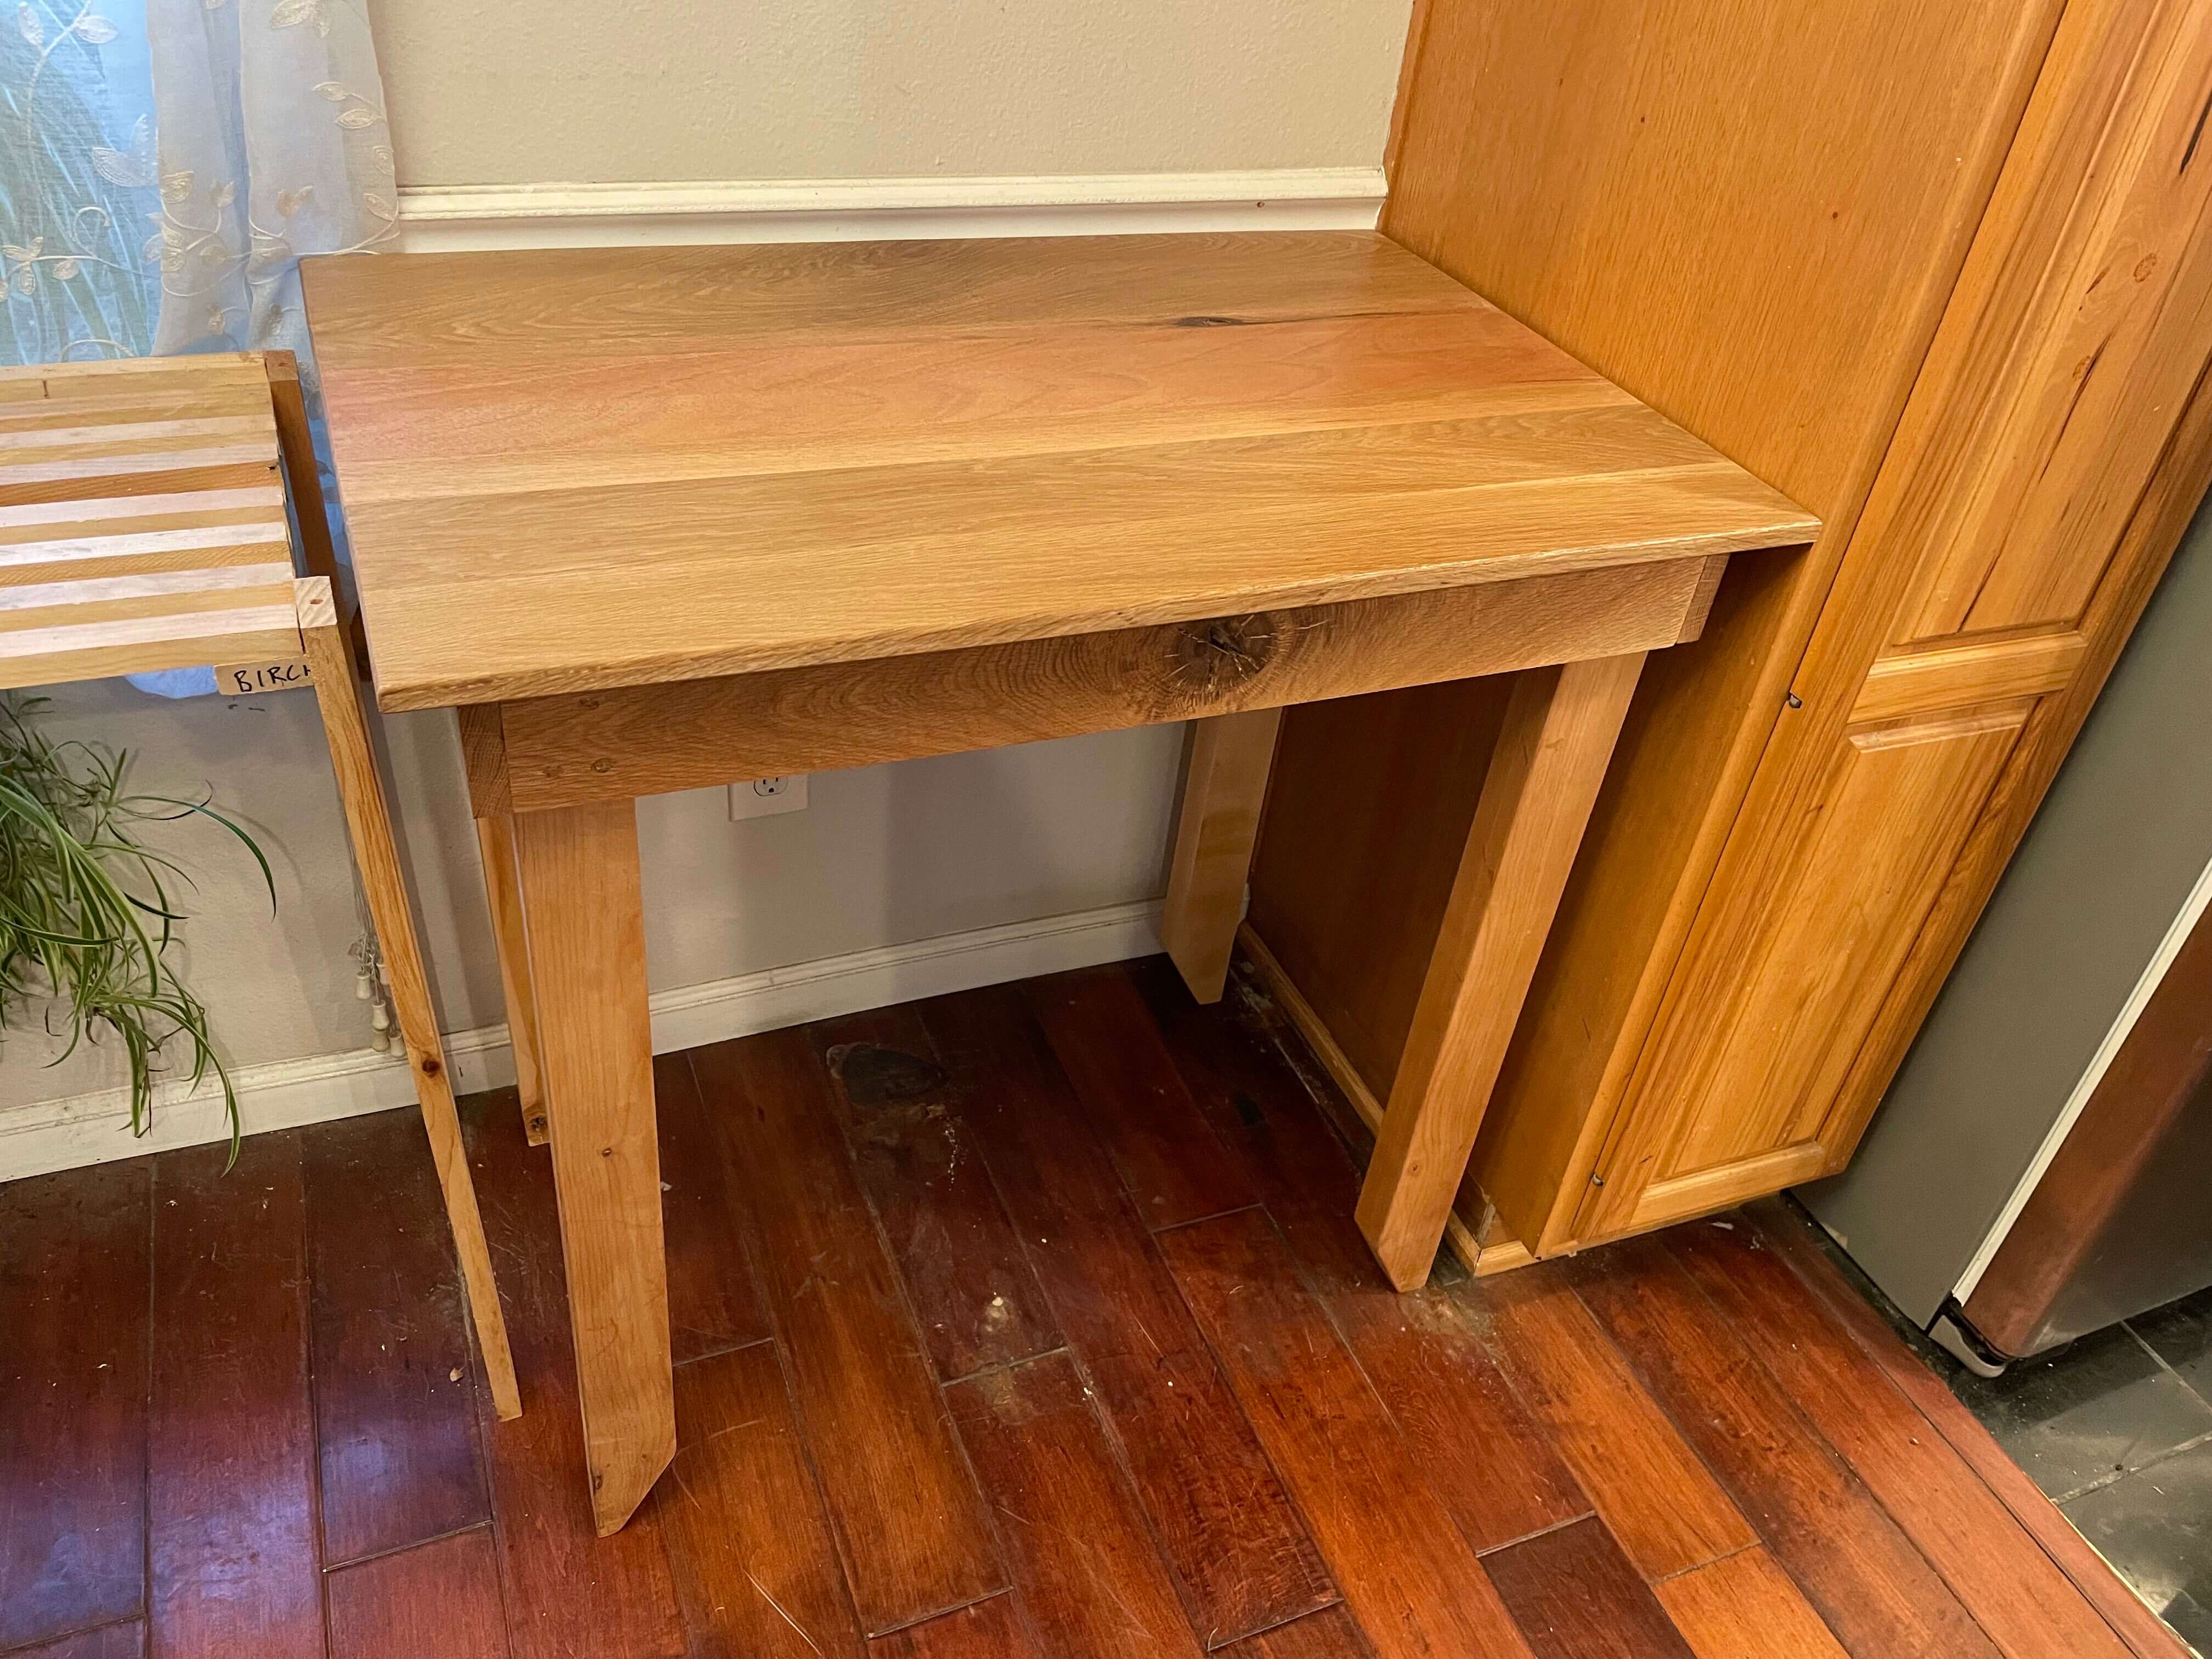
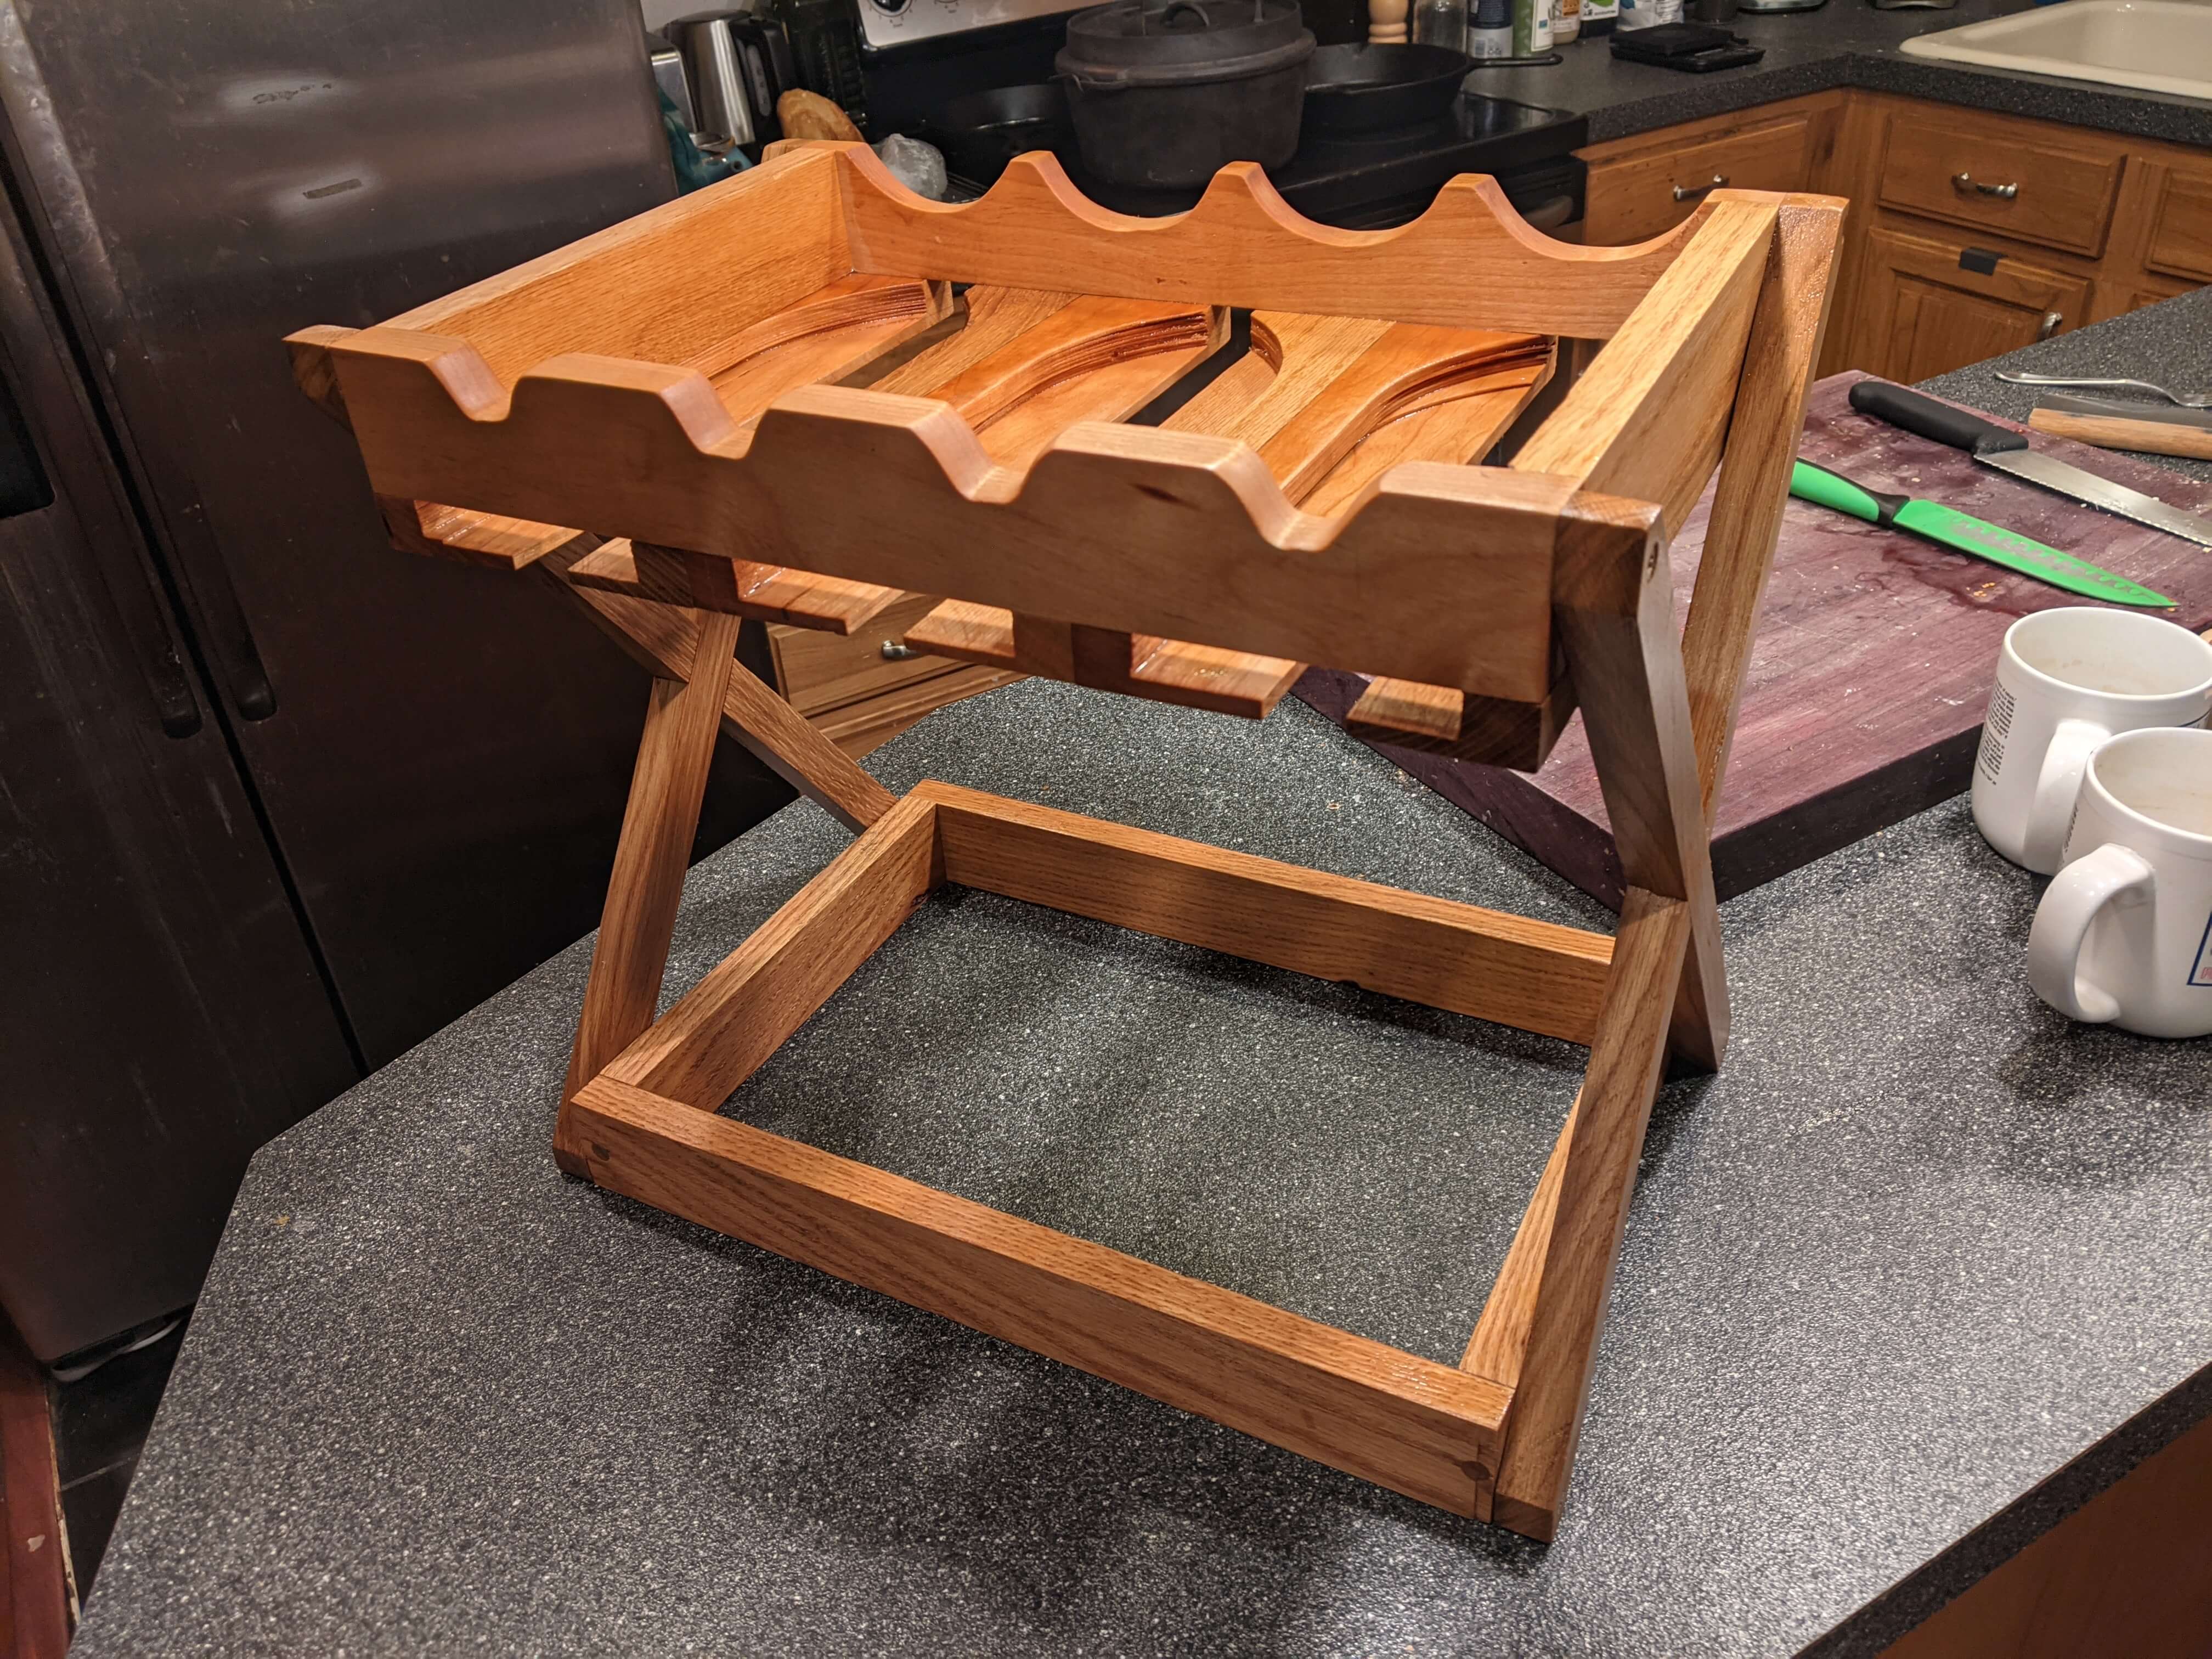
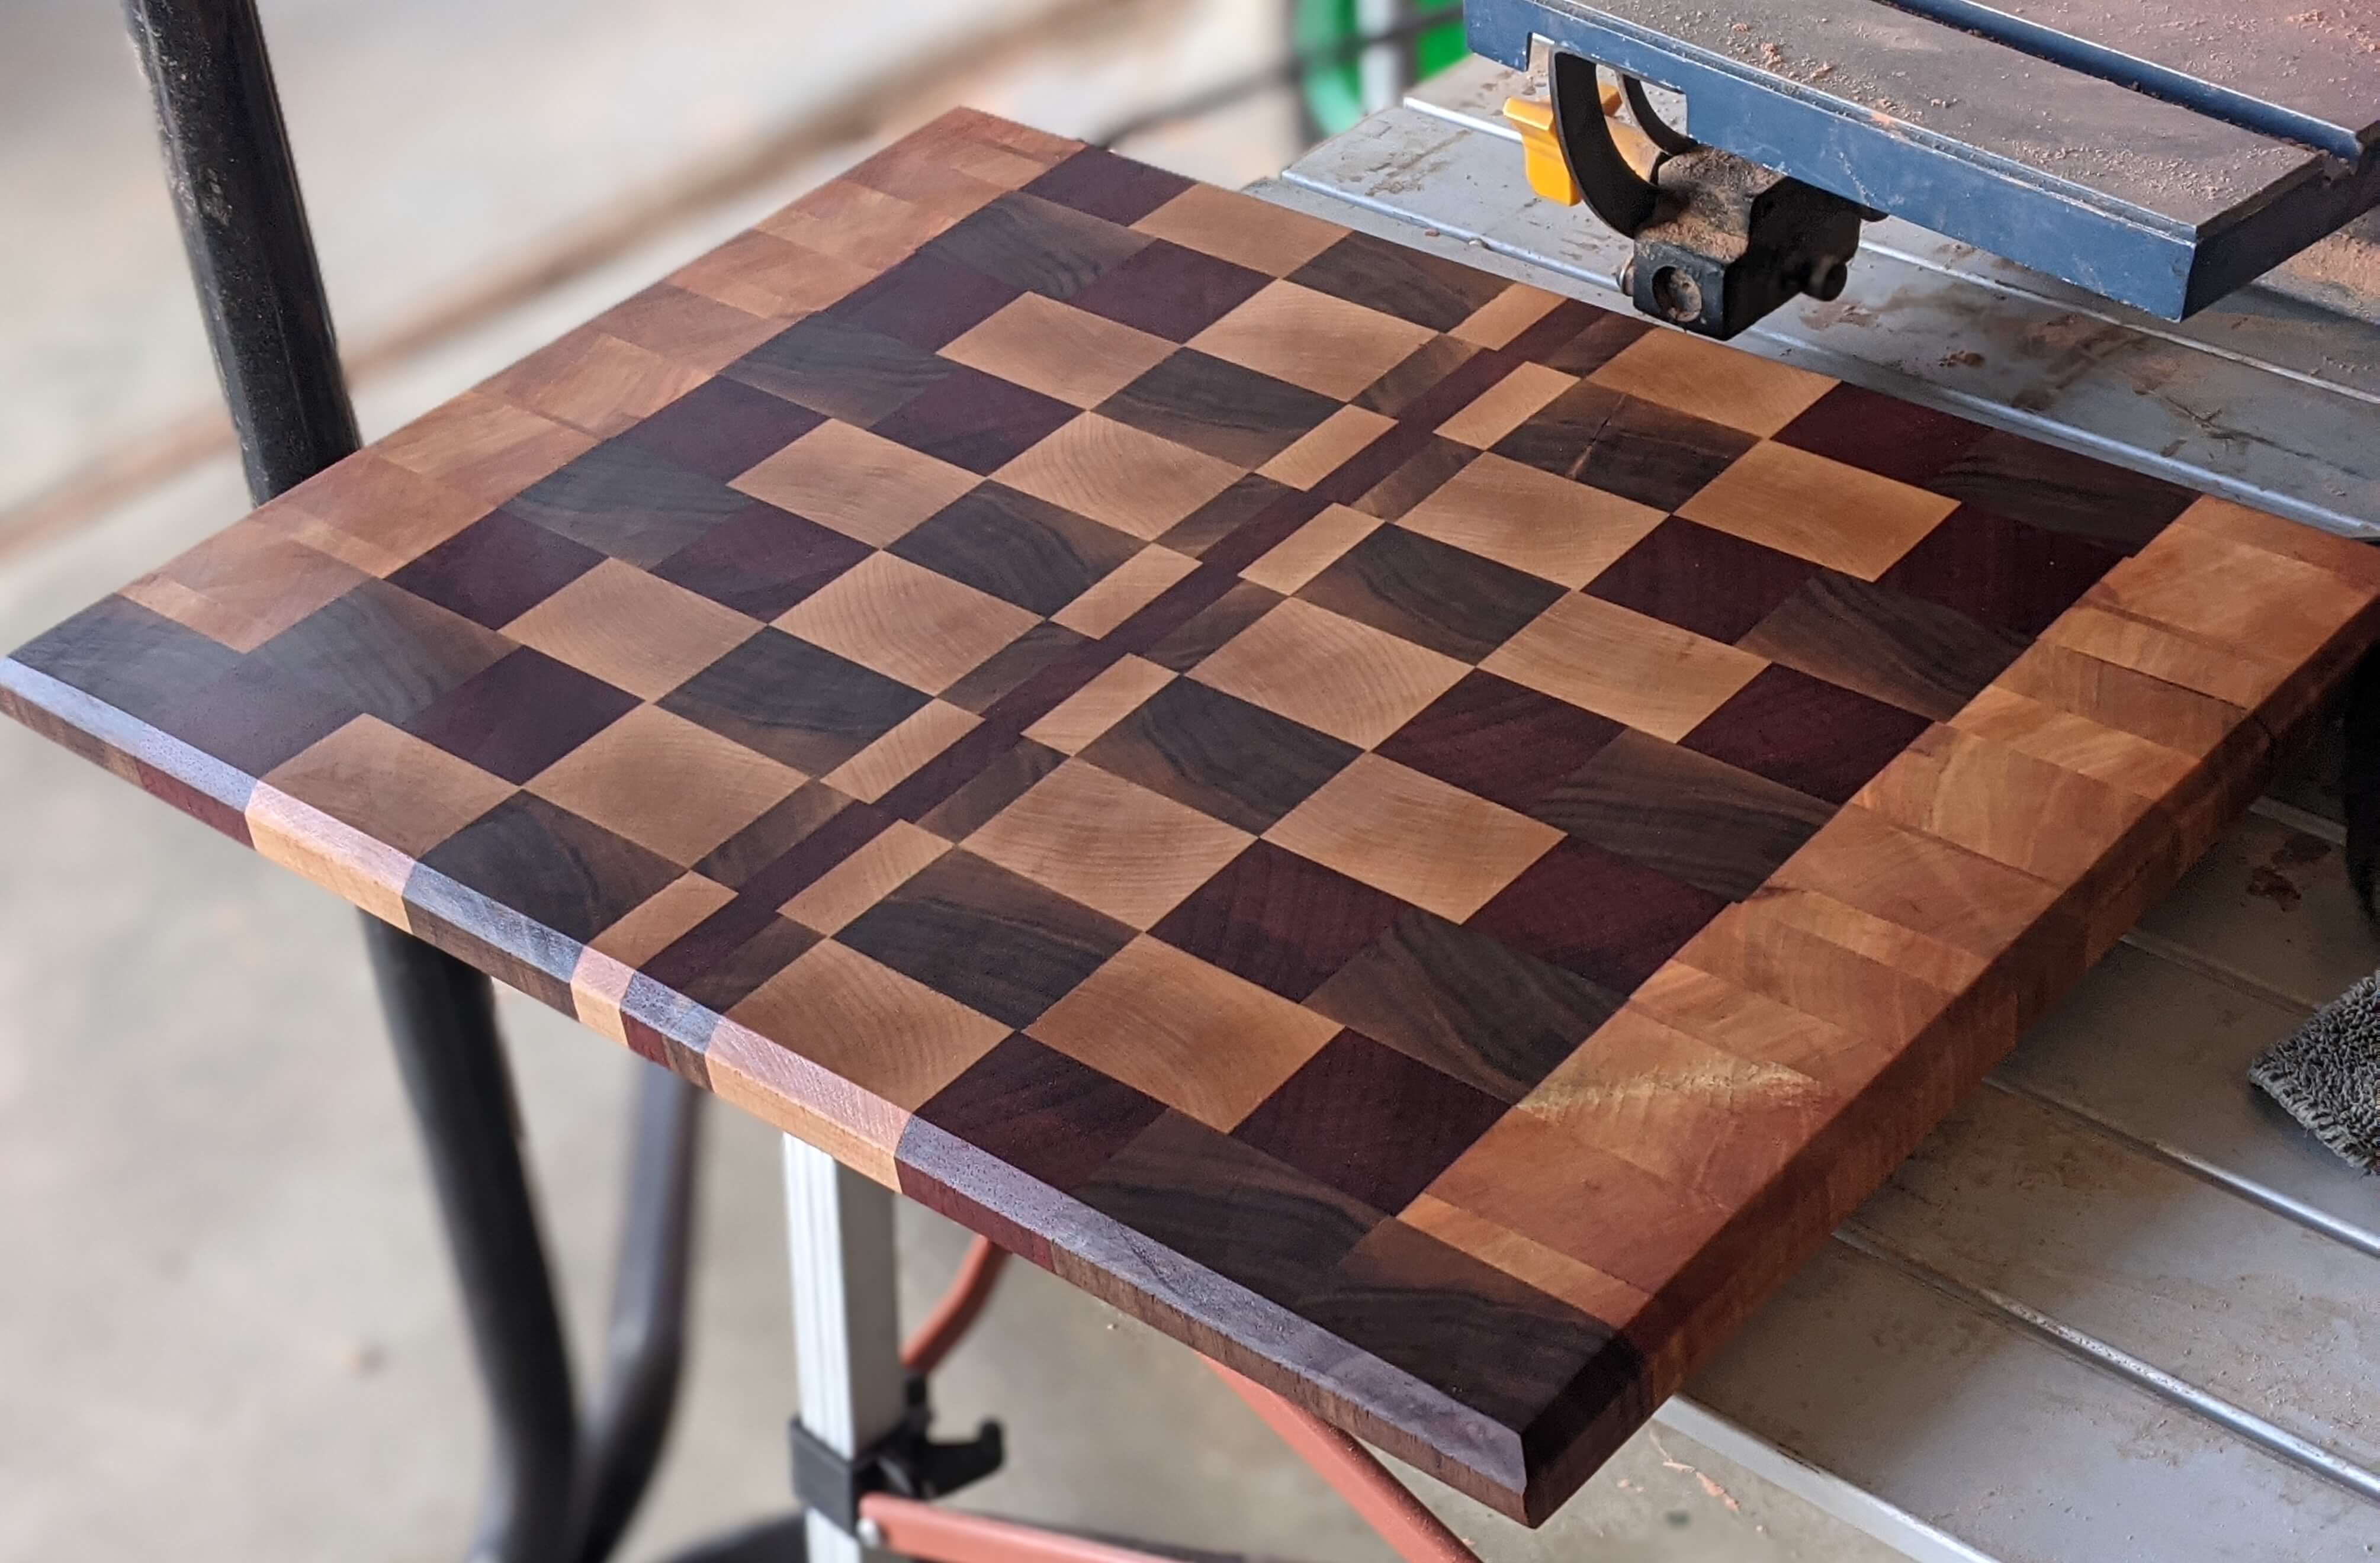
Woodworking
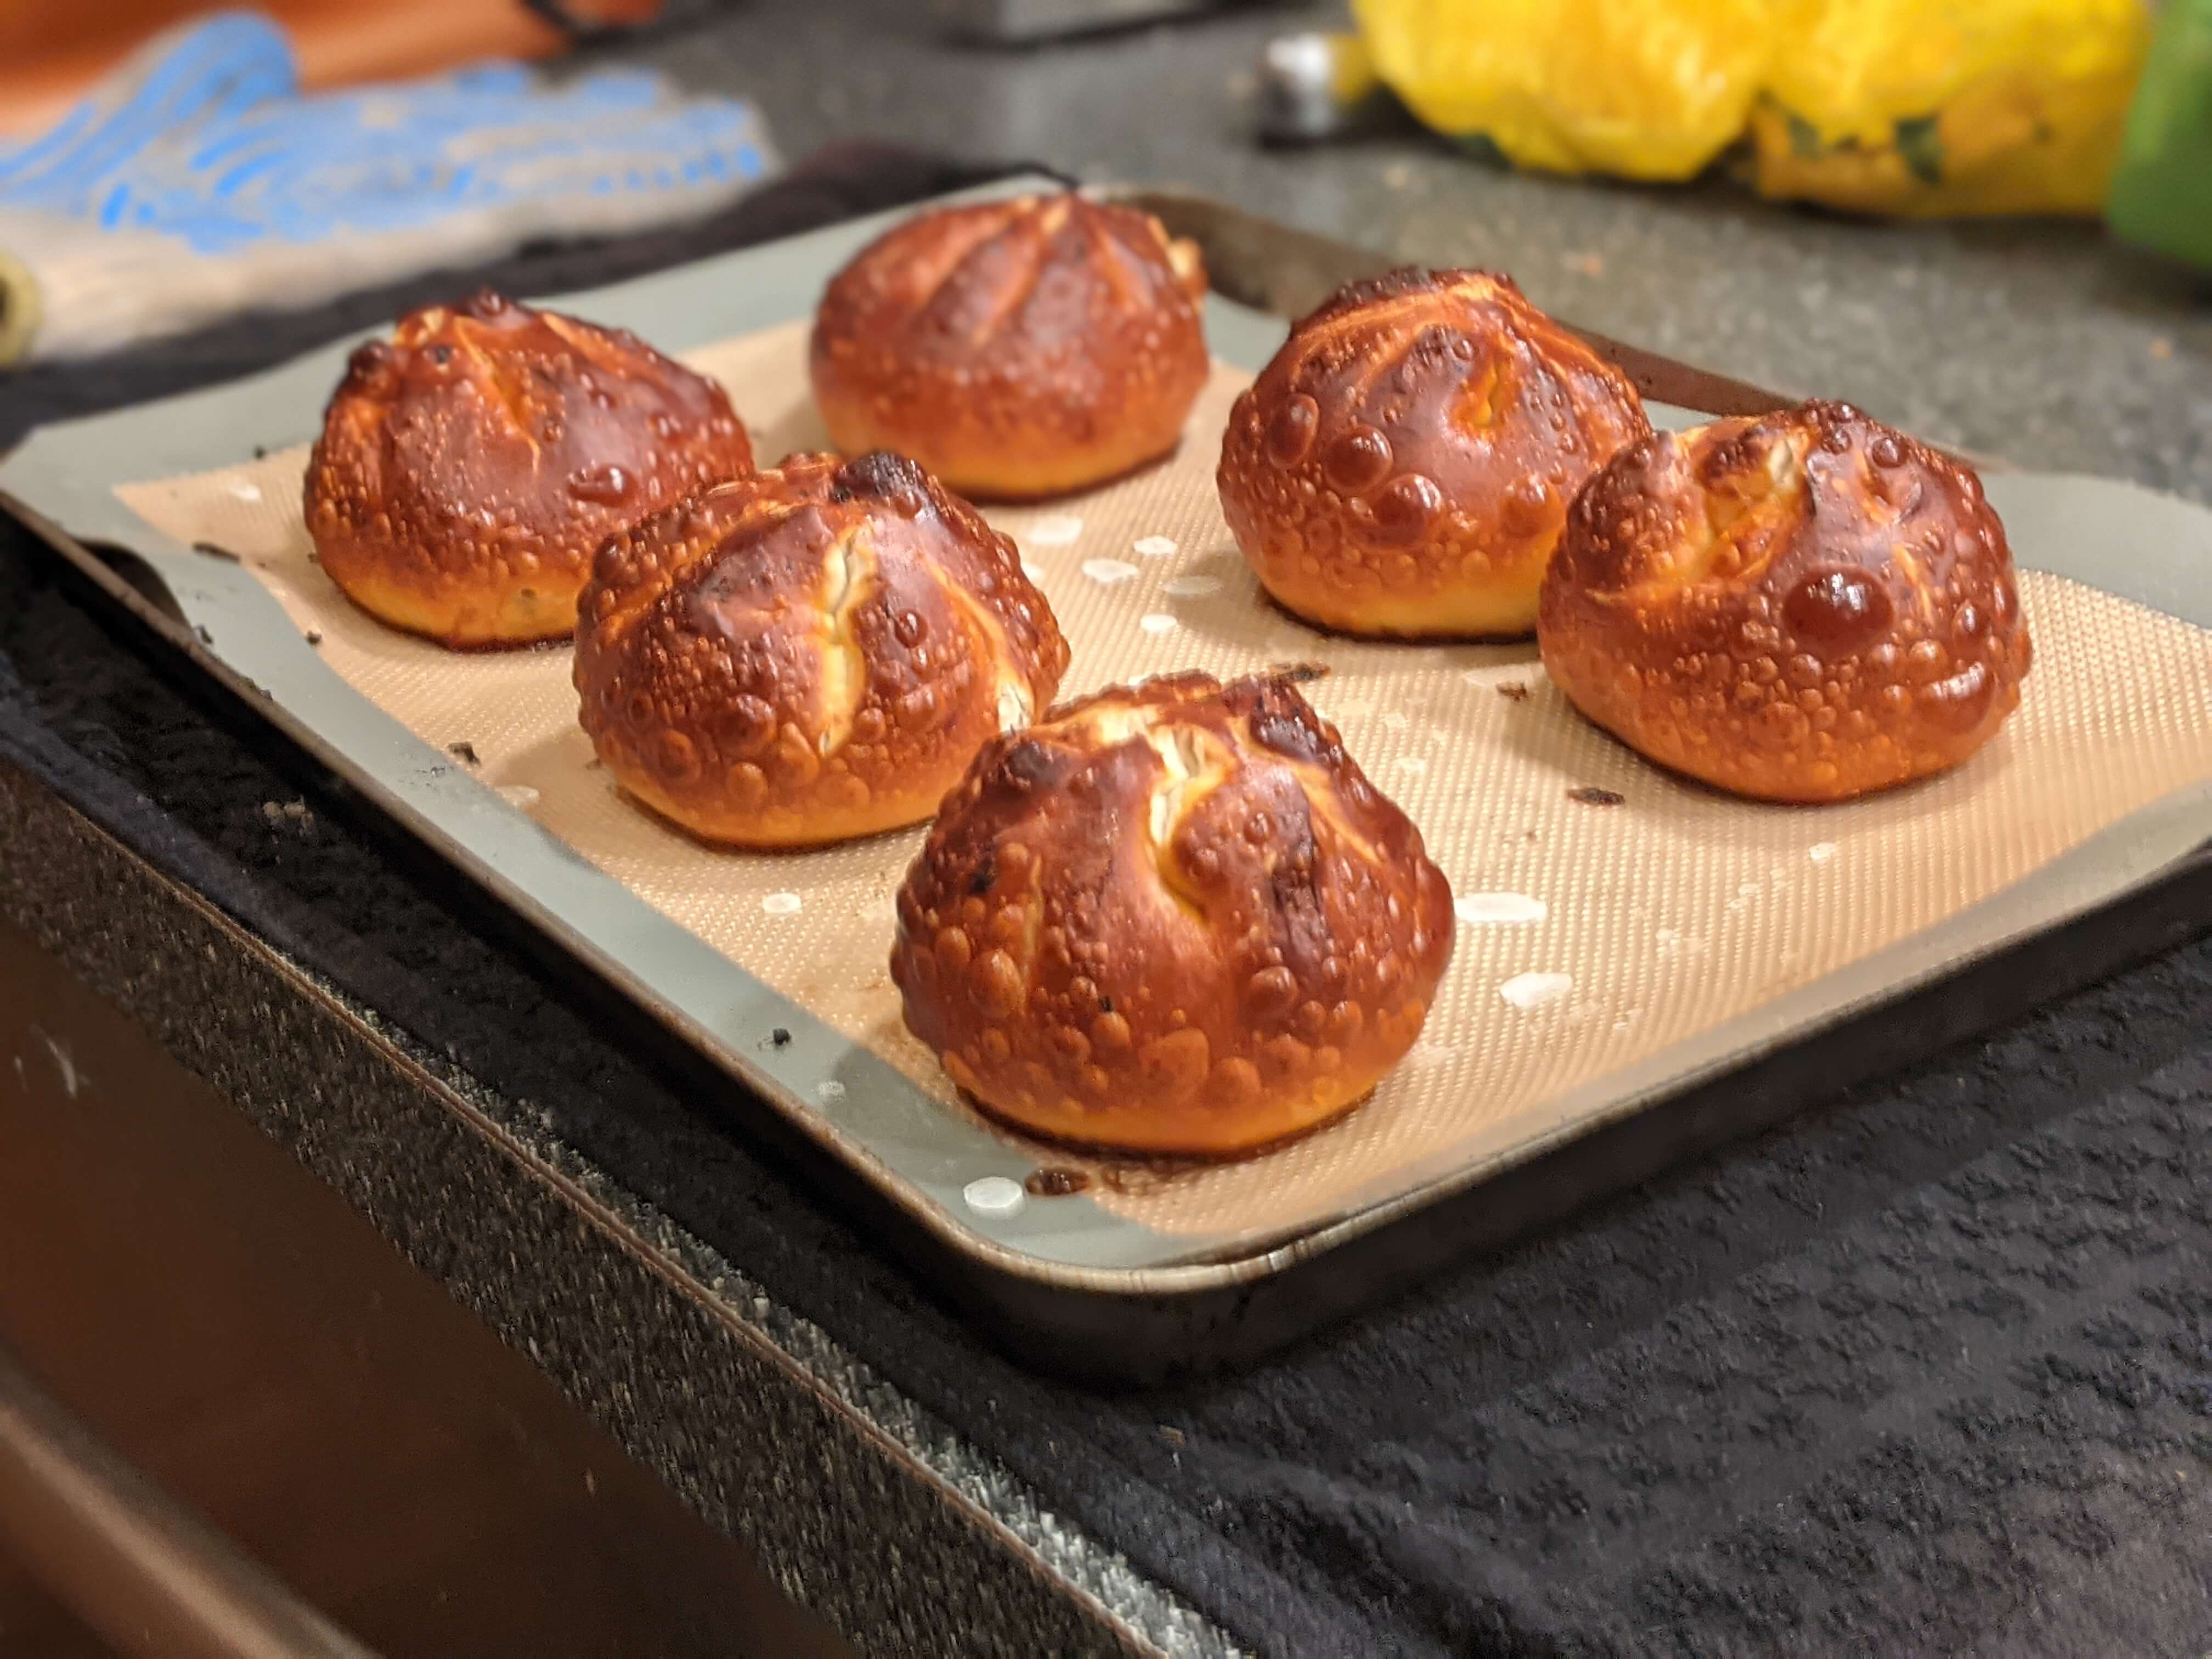
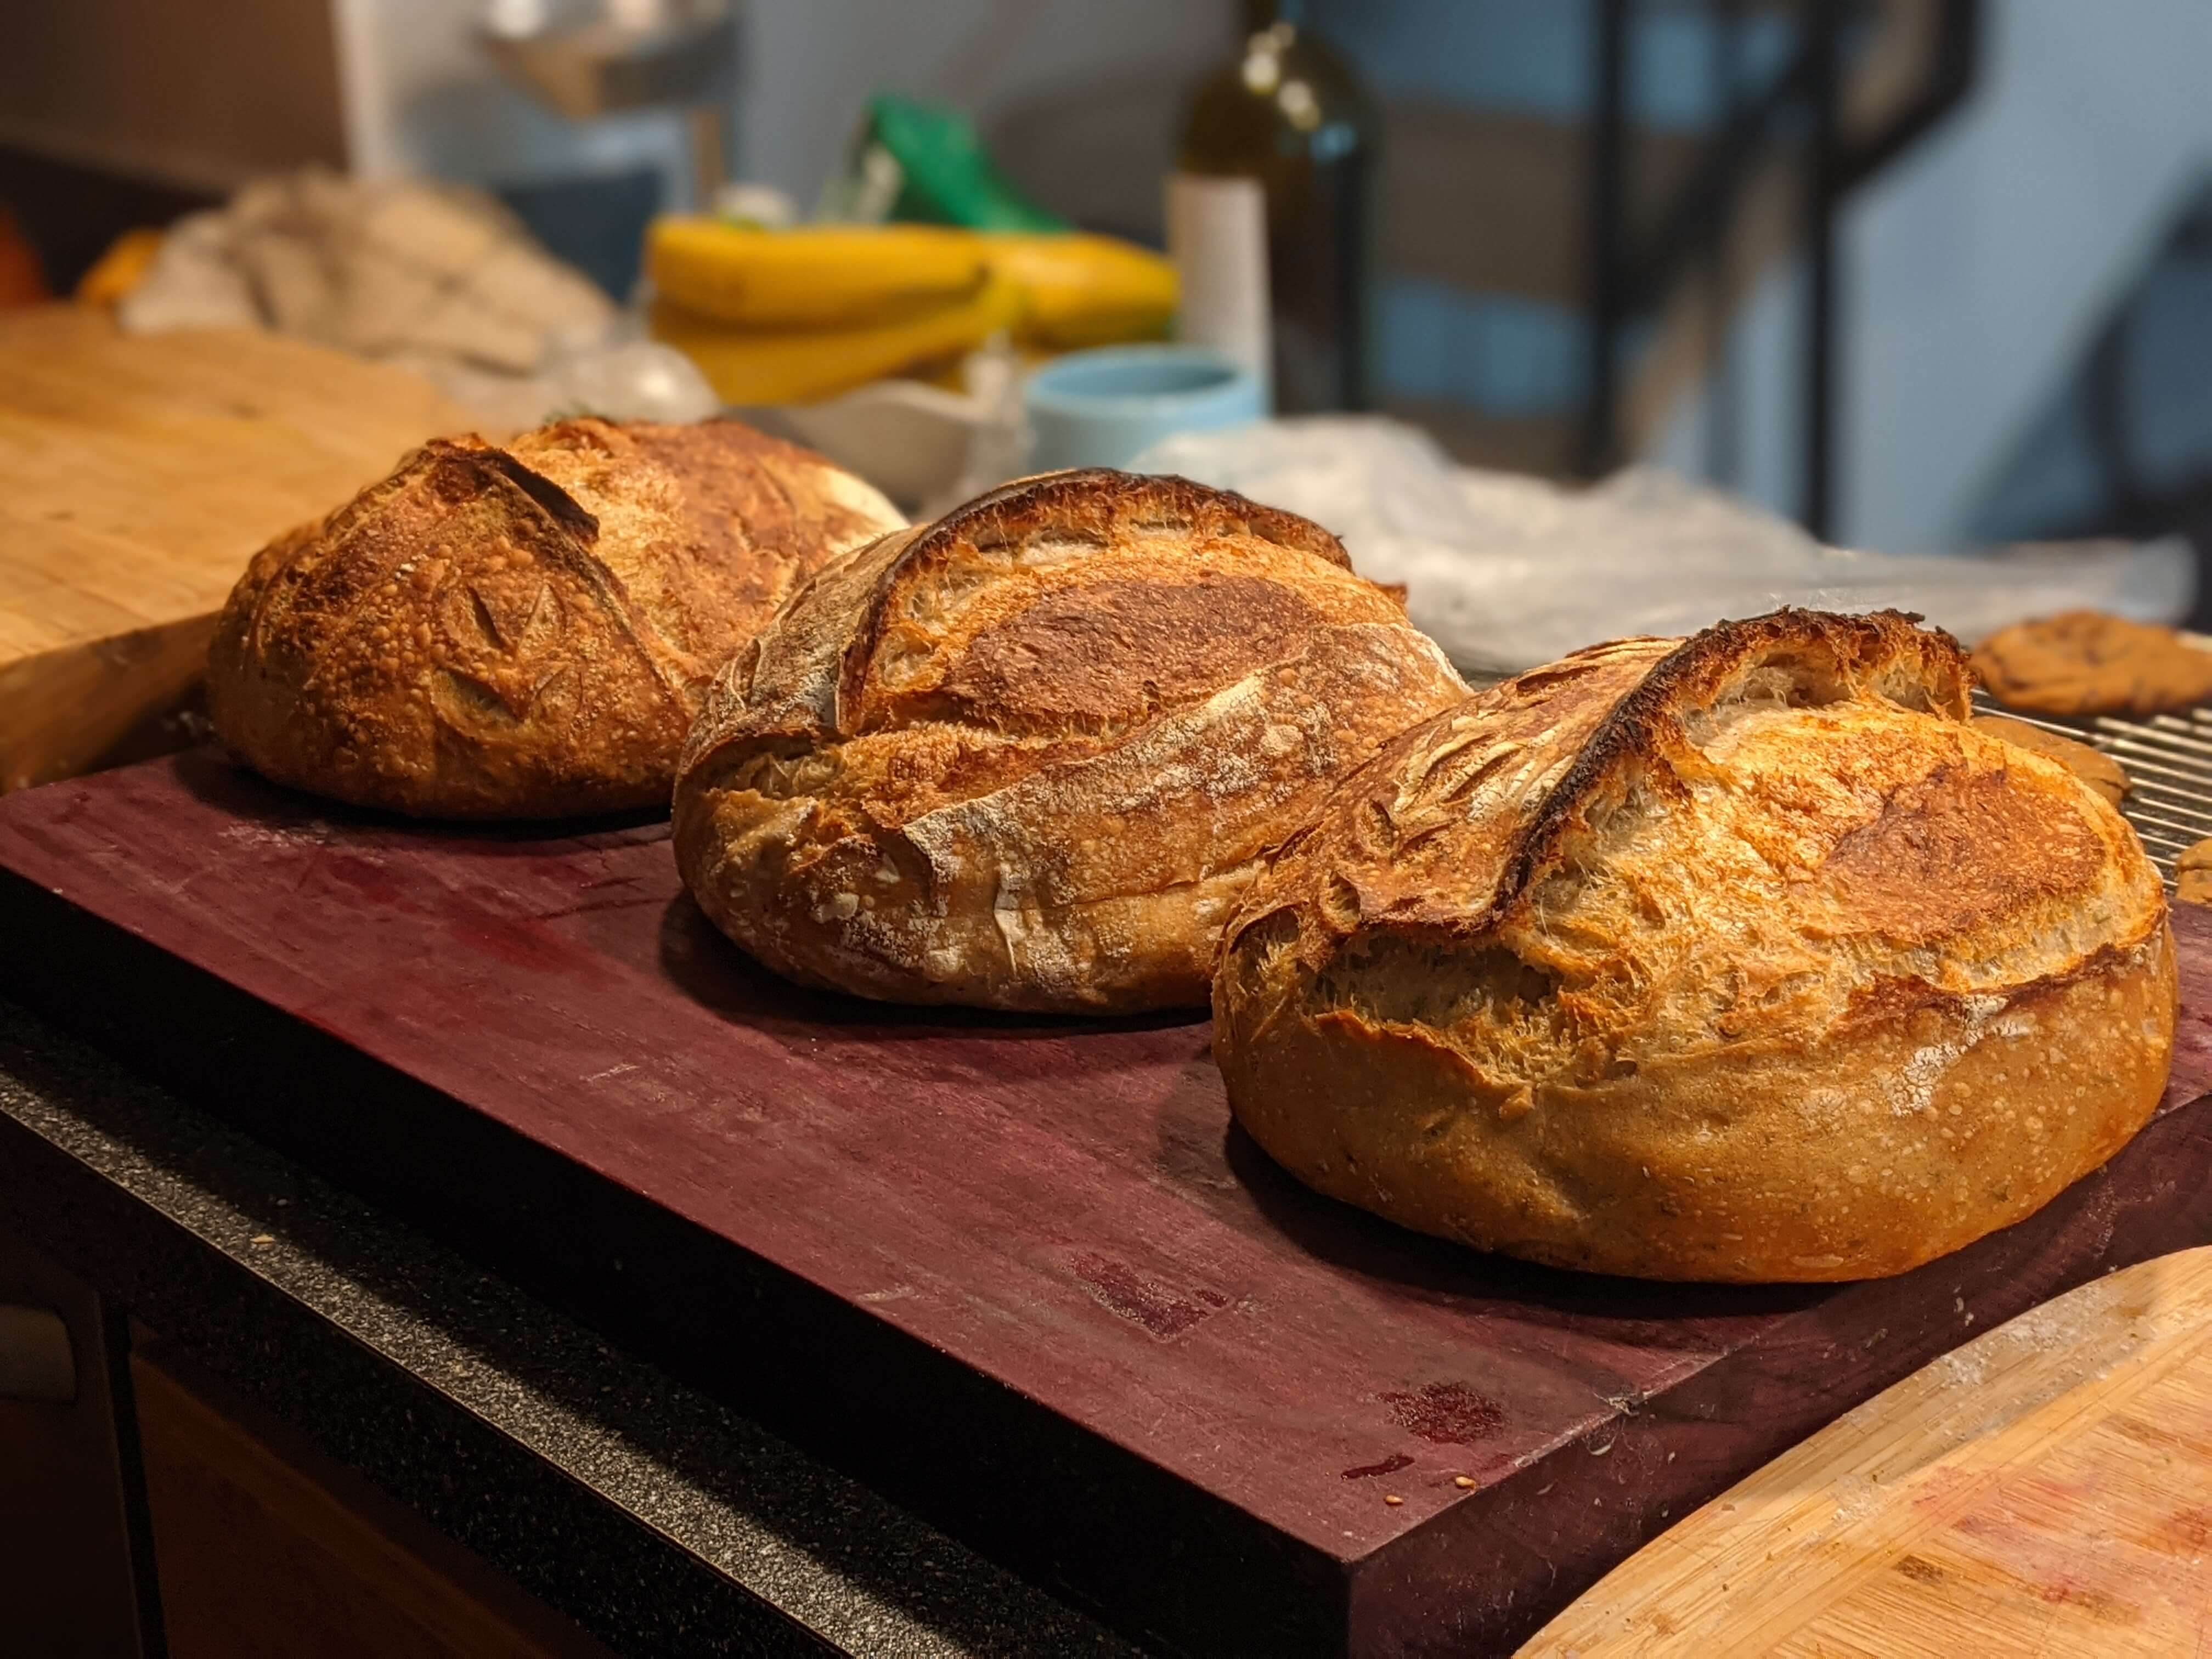
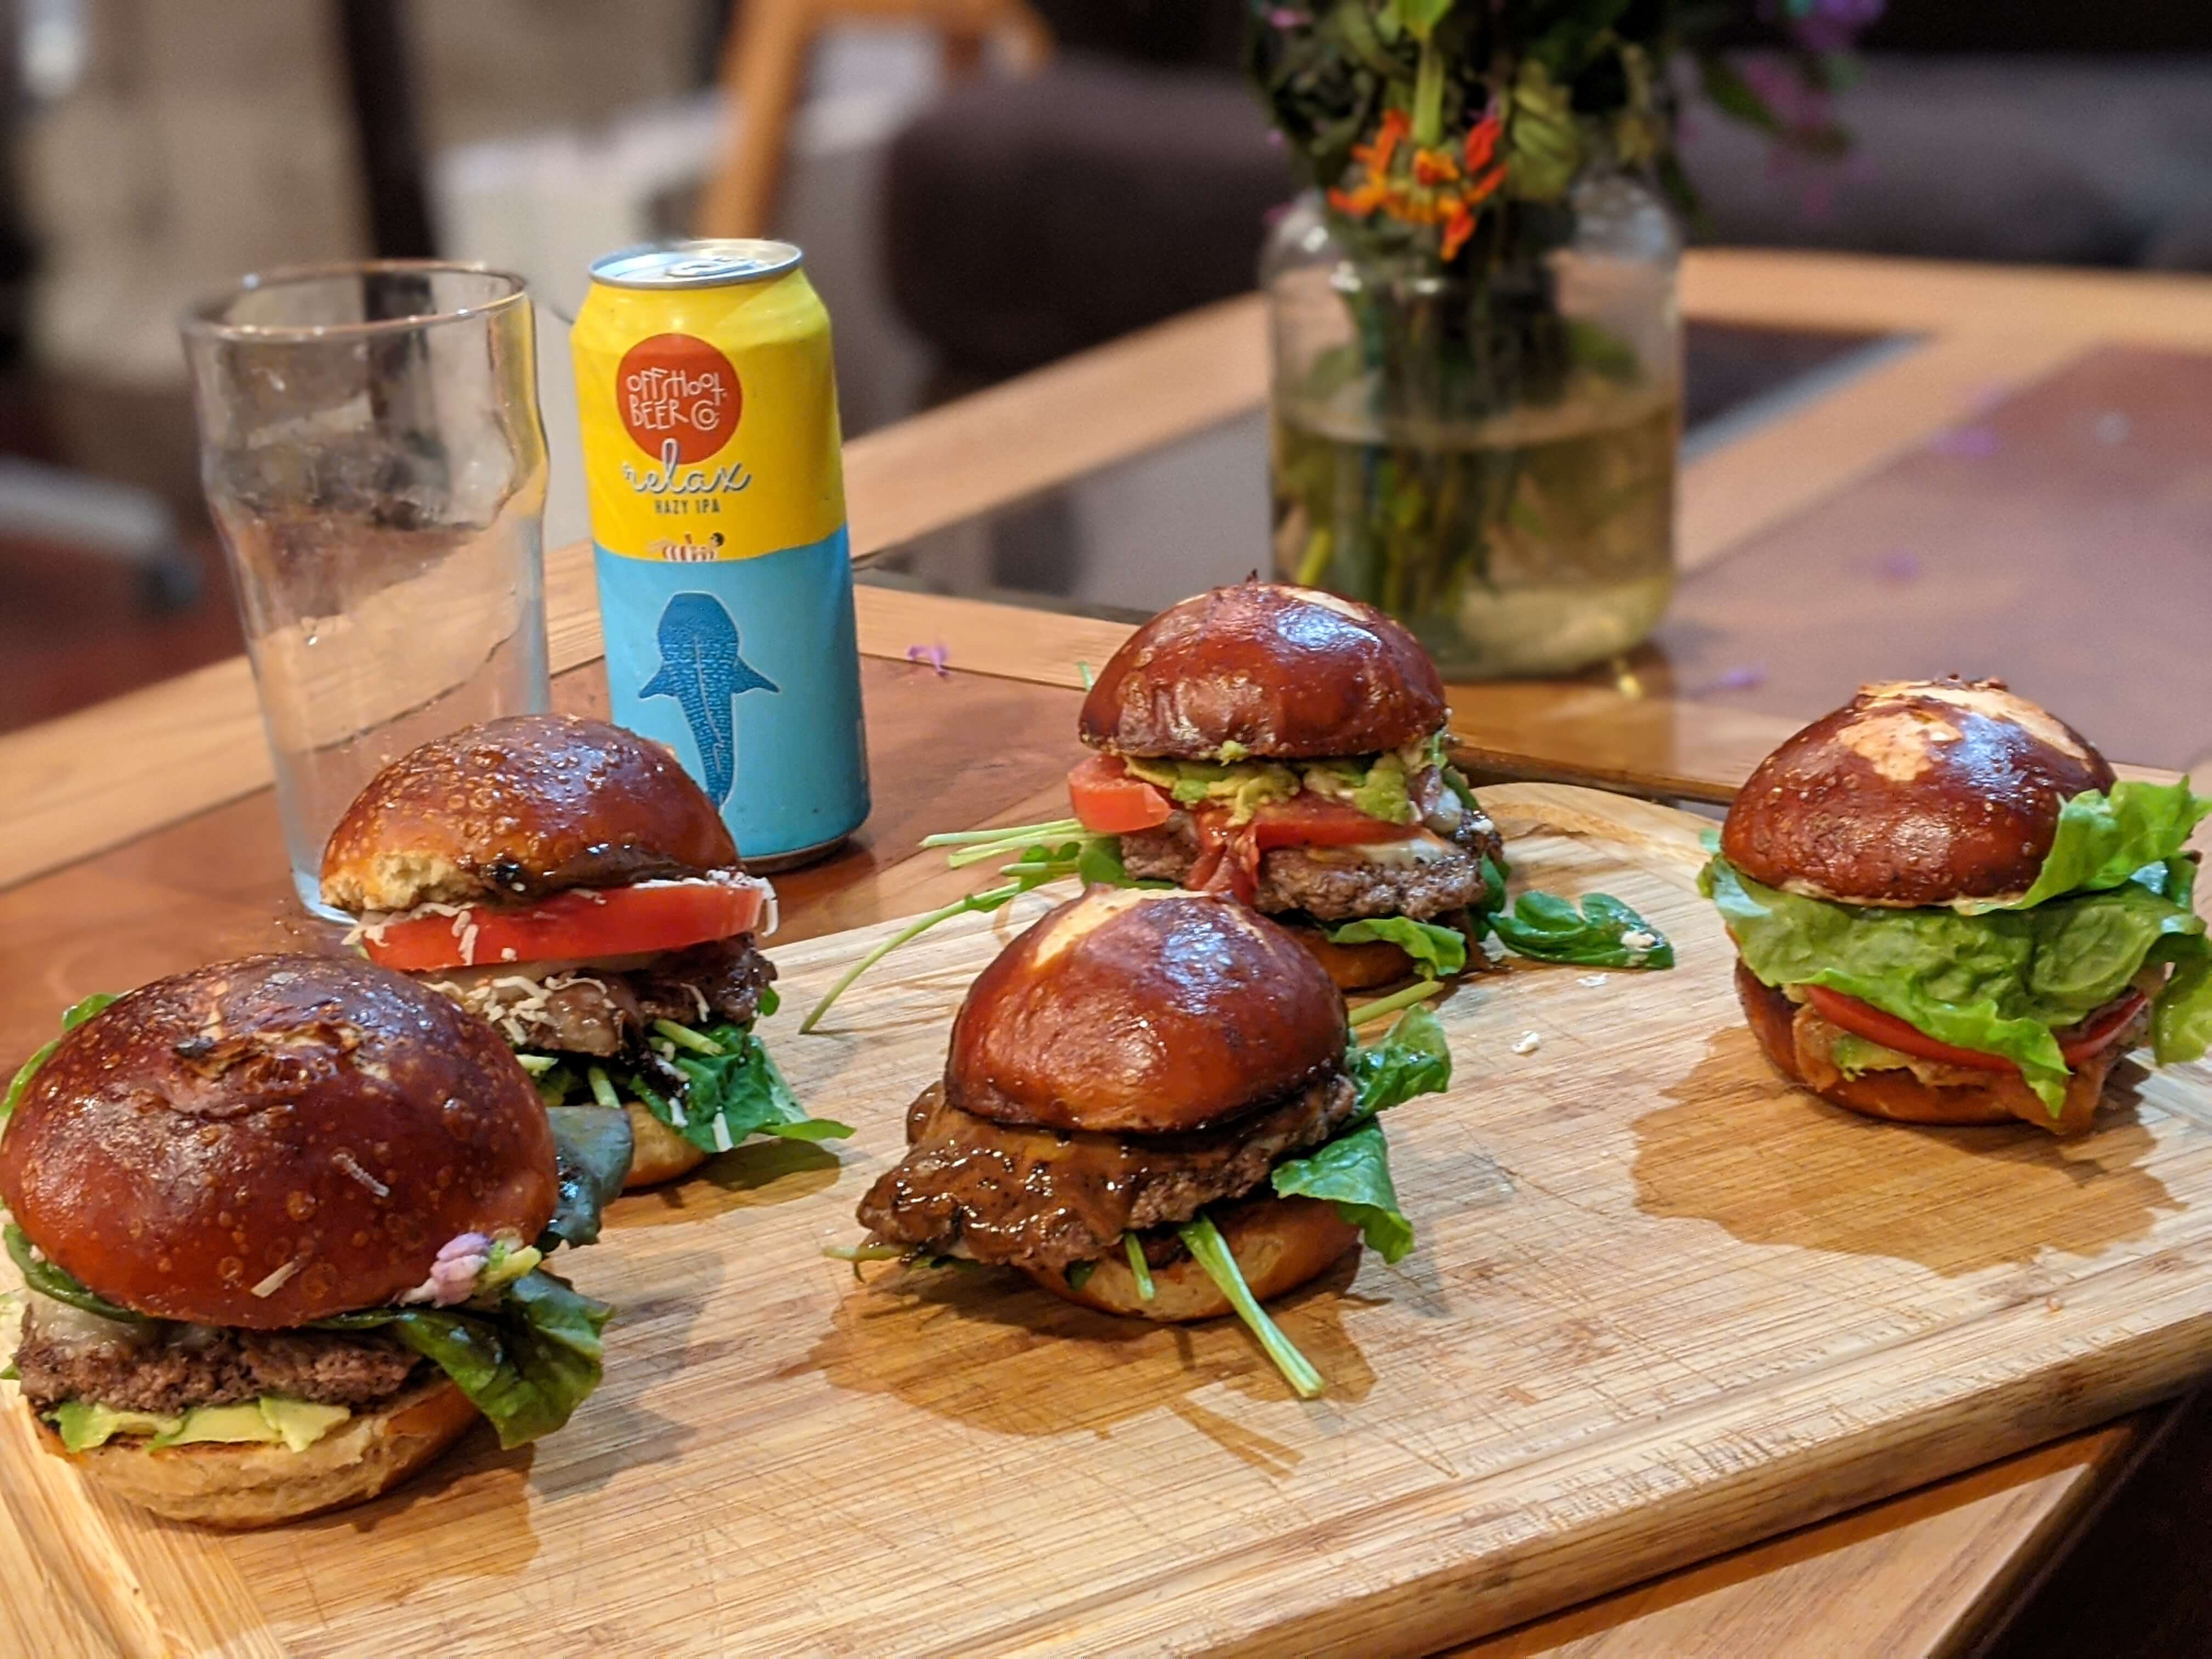
Cooking + Baking
Cheese Making
.jpg)